. 2004 May 11;32(8):2632-41.
doi: 10.1093/nar/gkh599. Print 2004.

Mismatch cleavage by single-strand specific nucleases

Affiliations

Mismatch cleavage by single-strand specific nucleases

Bradley J Till et al. Nucleic Acids Res. .

Abstract

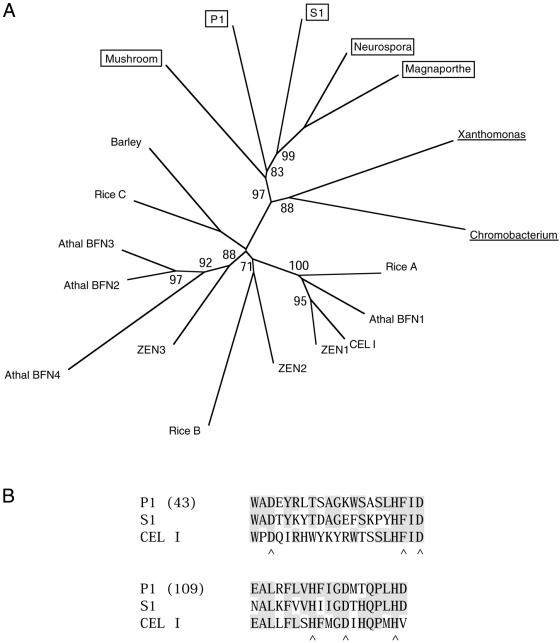
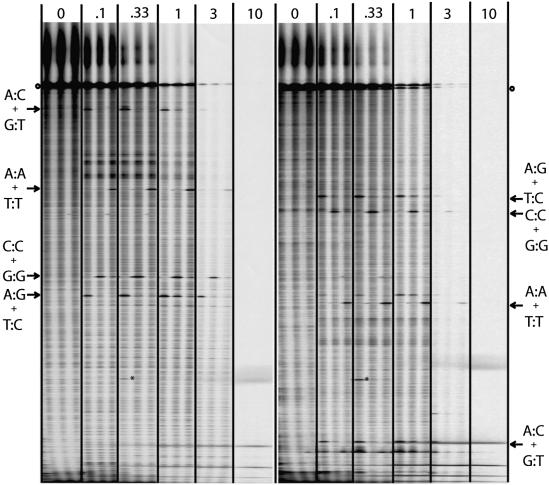
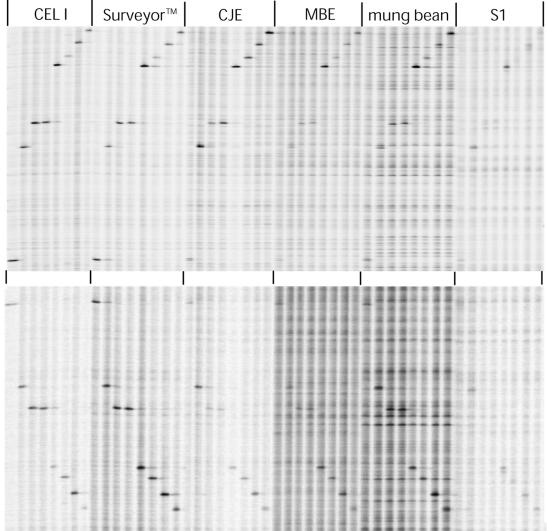
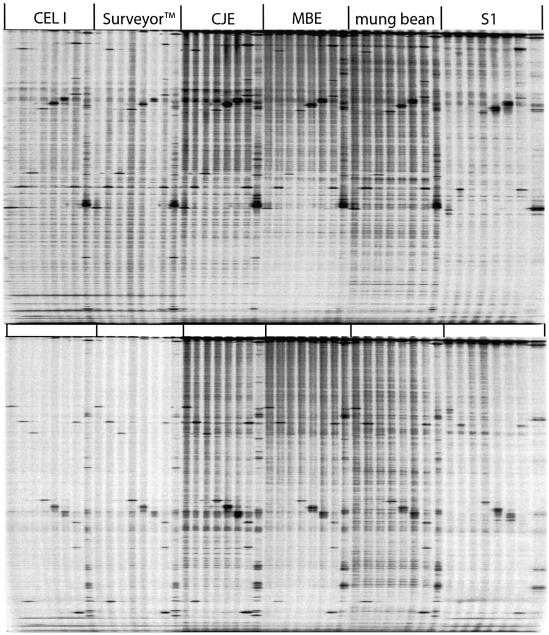
We have investigated the ability of single-strand specific (sss) nucleases from different sources to cleave single base pair mismatches in heteroduplex DNA templates used for mutation and single-nucleotide polymorphism analysis. The TILLING (Targeting Induced Local Lesions IN Genomes) mismatch cleavage protocol was used with the LI-COR gel detection system to assay cleavage of amplified heteroduplexes derived from a variety of induced mutations and naturally occurring polymorphisms. We found that purified nucleases derived from celery (CEL I), mung bean sprouts and Aspergillus (S1) were able to specifically cleave nearly all single base pair mismatches tested. Optimal nicking of heteroduplexes for mismatch detection was achieved using higher pH, temperature and divalent cation conditions than are routinely used for digestion of single-stranded DNA. Surprisingly, crude plant extracts performed as well as the highly purified preparations for this application. These observations suggest that diverse members of the S1 family of sss nucleases act similarly in cleaving non-specifically at bulges in heteroduplexes, and single-base mismatches are the least accessible because they present the smallest single-stranded region for enzyme binding. We conclude that a variety of sss nucleases and extracts can be effectively used for high-throughput mutation and polymorphism discovery.


Figures

Figure 1
Figure 1
(A) Phylogenetic tree of fungal (boxed), bacterial (underlined) and plant members of the S1 family of sss nucleases. ClustalW (35) was used to produce a global alignment and a neighbor-joining bootstrap tree (excluding gapped regions), which was displayed using TreeView (http://taxonomy.zoology.gla.ac.uk/rod/rod.html). Bootstrap percentages >70% are shown, based on 1000 trials. Rice A–C and A.thaliana BFN2-4 sequence numbers are arbitrary. (B) Alignment of S1 and CEL I nucleases with the two catalytic regions in P1 nuclease, with identical residues shaded. Based on the P1 structure (12), critical active site residues that coordinate zinc ions are indicated by carets. GenBank accession numbers for sequences used are: CEL I, AAF42954; A.thaliana BFN1, NP_172585; BFN2, NP_567631.1; BFN3, PIR_T05167; BFN4, PIR_T05168; ZEN1, BAA28948.1; ZEN2, AAD00694.1; ZEN3, AAD00695.1; rice A, BAB03377.1; rice B, CAE04161.3; rice C, NP_909099.1; barley, BAA82696.1; rice B, CAE04161.3; Neurospora, XP_331586.1; Magnaporthe, EAA47610.1; P1, NUP1_PENCI; S1, NUS1_ASPOR; Mushroom, PIR_JC7275; Xanthomonas, NP_638544; Chromobacterium, NP_899730.
Figure 2
Figure 2
CEL I concentration dependence for detection of single base pair mismatches. Increasing concentrations of CEL I nuclease were added to three PCR-amplified and heteroduplexed PIF2 test samples (J, K and L in Table 1) using standard TILLING conditions and LI-COR-based detection. For each CEL I concentration tested, all possible single base pair mismatches were evaluated (see Table 1). Panels from left to right are no enzyme, 0.1, 0.33, 1, 3 and 10 U/ml. Both IRD700 (left) and IRD800 (right) channels are shown to display the size distribution of bands for each labeled strand. Bands resulting from confirmed mismatch cleavages are marked (arrows). Cleavages occur on either strand at a mismatched base, yielding product sizes that add up to that of the full-length band (992 bp, marked by circles). A prominent example of a sporadic mispriming product is seen in the first lane of the 0.33 U/ml sample, identified as comigrating bands seen in both channels (marked by asterisks). Some contamination of adjacent lanes is not uncommon, such as the first lane in the 1 U/ml sample that contaminates the lane to the right.
Figure 3
Figure 3
Comparison of sss nuclease preparations for detection of G:C→A:T transitions. OXI1 heteroduplexes (A–H in Table 1) were digested and products displayed as in Figure 2, except that optimized enzyme–buffer cocktails and incubation conditions were used. Enzymes are present at 1 U/ml. From left to right: CEL I in CEL I buffer (10 mM KCl, 10 mM MgSO4, 10 mM HEPES pH 7.5, 0.002% Triton X100 and 0.0002 mg/ml BSA), 45°C, 15 min; Surveyor™ in CEL I buffer, 45°C, 15 min; CJE in CEL I buffer, 45°C, 15 min; MBE in Bis–Tris buffer (10 mM MgSO4, 0.2 mM ZnSO4, 20 mM Bis–Tris pH 6.5, 0.002% Triton X100 and 0.0002 mg/ml BSA), 60°C, 30 min; mung bean nuclease in Bis–Tris buffer, 60°C, 30 min; S1 nuclease in 2 mM ZnCl2, 10 mM potassium acetate pH 5.5, 10 mM MgSO4, 0.002% Triton X100 and 0.0002 mg/ml BSA, 45°C, 30 min. Top, IRD700; bottom, IRD800, where the image gain was increased overall for clarity.
Figure 4
Figure 4
Comparison of sss nuclease preparations for detection of mismatches and loop-outs. All different mismatches (A:C and G:T in lanes 1, 2 and 7, T:C and C:A in lanes 2 and 7, C:C and G:G in lane 3, T:T and A:A in lane 4), three deletions (9 bp in lane 5, 3 bp in lane 6 and 2 bp in lane 7) and >30 polymorphisms (lane 8), are represented in the two channels. PIF2 heteroduplexes (I–P in Table 1) were digested and products displayed as in Figures 2 and 3, with the full-length product at the top. Conditions are the same as for Figure 3. Top, IRD700; bottom, IRD800, where the image gain was increased overall for clarity.

Similar articles

Cited by

References

    1. Desai N.A. and Shankar,V. (2003) Single-strand-specific nucleases. FEMS Microbiol. Rev., 26, 457–491. - PubMed
    1. Shenk T.E., Rhodes,C., Rigby,P.W. and Berg,P. (1975) Biochemical method for mapping mutational alterations in DNA with S1 nuclease: the location of deletions and temperature-sensitive mutations in simian virus 40. Proc. Natl Acad. Sci. USA, 72, 989–993. - PMC - PubMed
    1. Wiegand R.C., Godson,N. and Radding,C.M. (1975) Specificity of the S1 nuclease from Aspergillus oryzae. J. Biol. Chem., 250, 8848–8855. - PubMed
    1. Berk A.J. (1989) Characterization of RNA molecules by S1 nuclease analysis. Methods Enzymol., 180, 334–347. - PubMed
    1. Colbert T., Till,B.J., Tompa,R., Reynolds,S., Steine,M.N., Yeung,A.T., McCallum,C.M., Comai,L. and Henikoff,S. (2001) High-throughput screening for induced point mutations. Plant Physiol., 126, 480–484. - PMC - PubMed

Publication types

MeSH terms

Substances