. 2004 May 11;32(8):2642-51.
doi: 10.1093/nar/gkh587. Print 2004.

Localization and dynamics of small circular DNA in live mammalian nuclei

Affiliations

Localization and dynamics of small circular DNA in live mammalian nuclei

Giulia Mearini et al. Nucleic Acids Res. .

Abstract

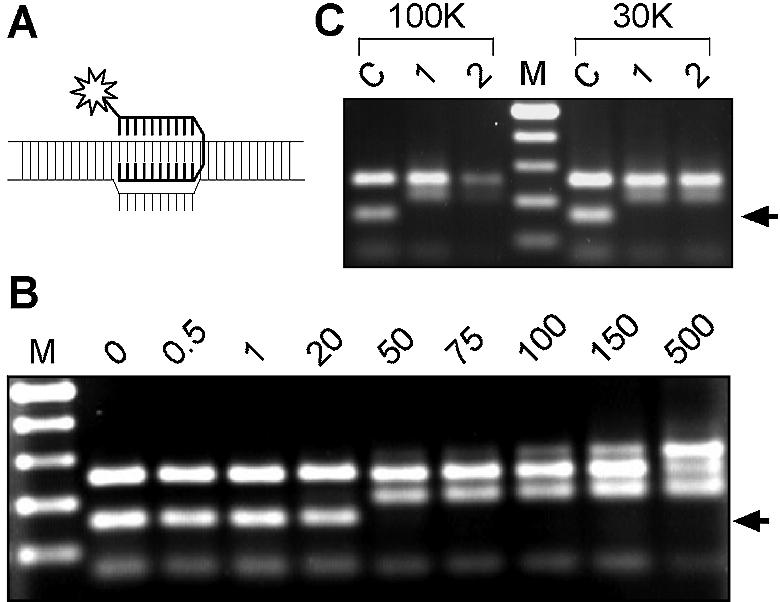
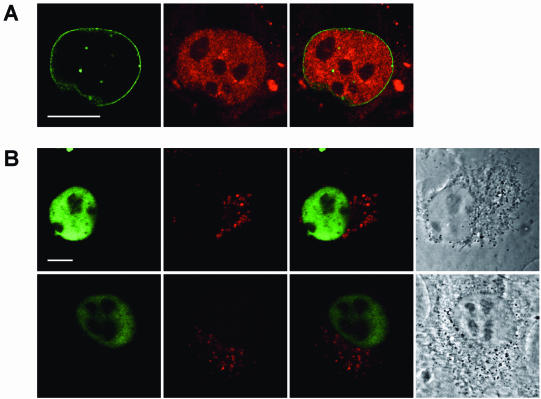
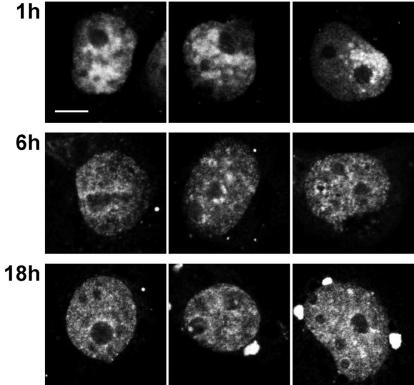
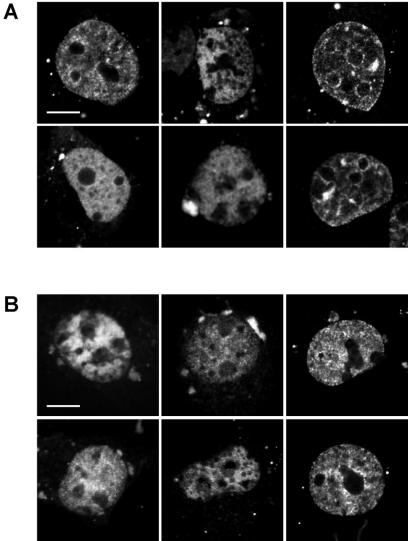
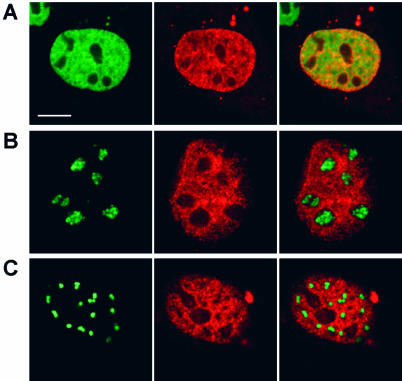
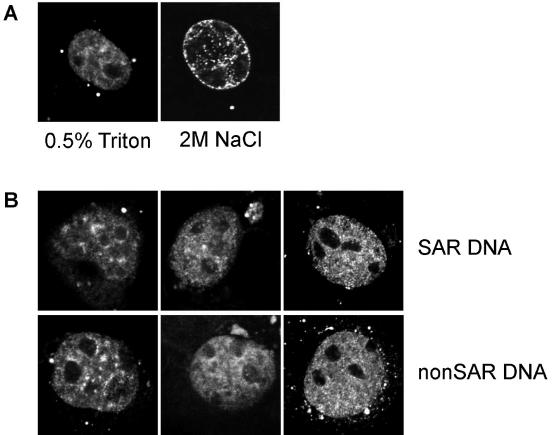
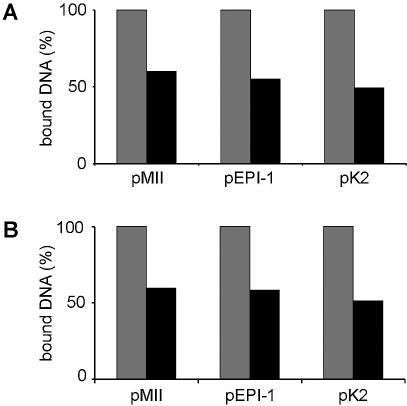
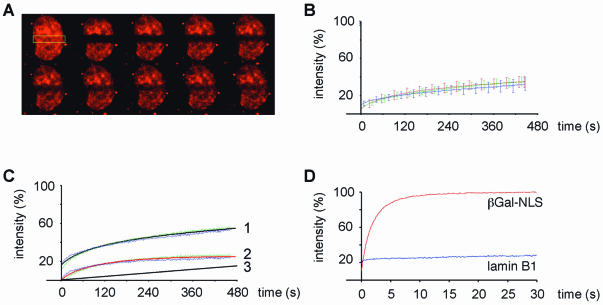
While genomic DNA, packaged into chromatin, is known to be locally constrained but highly dynamic in the nuclei of living cells, little is known about the localization and dynamics of small circular DNA molecules that invade cells by virus infection, application of gene therapy vectors or experimental transfection. To address this point, we have created traceable model substrates by direct labeling of plasmid DNA with fluorescent peptide nucleic acids, and have investigated their fate after microinjection into living cells. Here, we report that foreign DNA rapidly undergoes interactions with intranuclear structural sites that strongly reduce its mobility and restrict the DNA to regions excluding nucleoli and nuclear bodies such as PML bodies. The labeled plasmids partially co-localize with SAF-A, a well characterized marker protein for the nuclear 'scaffold' or 'matrix', and are resistant towards extraction by detergent and, in part, elevated salt concentrations. We show that the localization and the low mobility of plasmids is independent of the plasmid sequence, and does not require the presence of either a scaffold attachment region (SAR) DNA element or a functional promoter.


Figures

Figure 1
Figure 1
Labeling and purification of plasmid DNA by peptide nucleic acid (PNA). (A) Schematic representation of a PNA clamp bound to DNA. One part of the PNA molecule invades the DNA duplex to interact with the complementary DNA sequence according to Watson–Crick hydrogen bonding rules. Via a flexible linker, PNA folds back and the second part of the molecule binds to DNA via Hoogsteen base pairing. The PNA can be labeled with a fluorochrome (star). (B) Titration of the optimal PNA:DNA molar ratio for complex formation. Plasmid DNA was incubated with increasing amount of rhodamine-labeled PNA (0–500 molar excess) in TE (20 µl final volume) at 37°C for 3 h. After incubation, DNA/PNA complexes were digested with XbaI and KpnI (37°C for 3 h) and resulting fragments were analyzed by 1.5% agarose gel electrophoresis. The arrow indicates the fragment containing the PNA target site; note the complete and exclusive shift of this fragment. M, 100 bp DNA ladder. (C) Purification of labeled DNA. After labeling as described in (B), unbound PNA was removed by ultrafiltration over Centricon microconcentrators of 100 or 30 kDa molecular weight cutoff (Millipore). Persistence of the label on the specific fragment was verified by restriction and gel electrophoresis. Note the loss of complexes during the purification with 100 kDa cut-off filters. C, Control DNA with unbound PNA; 1, after labeling but before purification; 2, after purification; M, 100 bp DNA ladder.
Figure 2
Figure 2
(A) Cell viability after microinjection. COS7 cells grown on coverslips (Eppendorf) were microinjected directly into nuclei with a mixture of DNA/PNA complexes and an expression vector encoding for EGFP-LaminB1. Cells were fixed after 20 h with 3.5% paraformaldehyde and examined by confocal microscopy. Expression and correct localization of the lamin in the nuclear envelope (green) verifies that microinjection does not interfere with vital cellular functions. Note that the injected DNA/PNA complexes (red) remained entirely nuclear. (B) Microinjection of free PNA. COS7 cells were injected with a mixture of free rhodamine-labeled PNA and FITC-dextran of molecular weight 250 kDa. Cells were fixed with 3.5% paraformaldeyhde after 1 h (upper panel) or overnight (lower panel) from microinjection. Note that the mixture splits up into its two components, with free PNA (red) completely leaving the nucleus within less than 1 h, while dextran (green) remains nuclear. Scale bar, 10 µm.
Figure 3
Figure 3
Time course. COS7 cells were microinjected with DNA/PNA complexes into the nucleus, and fixed with 3.5% paraformaldehyde 1, 6 or 18 h after microinjection. Note the heterogeneous distribution 1 h after microinjection. In many cells the point of injection is visible as an accumulation of fluorescence (right panel). After 6 h, the plasmid has reached its final location that does not change further with longer incubation time. Three typical nuclei are shown per time point.
Figure 4
Figure 4
Intranuclear localization of DNA/PNA complexes. COS7 cells were microinjected into the nucleus with DNA/PNA complexes and analyzed by confocal microscopy after (A) 18 h alive and (B) fixation with 3.5% paraformaldehyde. Six representative nuclei are shown for each. Scale bar, 10 µm.
Figure 5
Figure 5
Plasmid DNA does not enter the nucleolus and nuclear bodies. COS7 cells were co-microinjected with DNA/PNA complexes and expression plasmids for (A) SAF-A, (B) hFibrillarin and (C) PML. After overnight incubation, cells were fixed for 10 min with 3.5% paraformaldehyde and examined by confocal microscopy. Note that fibrillarin and PML protein localize at nuclear sites devoid of plasmid DNA, while the localization of plasmid DNA and SAF-A are very similar.
Figure 6
Figure 6
Plasmid DNA is resistant towards detergent extraction and elevated ionic strength, and does not require a SAR DNA element. (A) COS7 nuclei microinjected with DNA/PNA complexes were treated with 0.5% Triton X-100 (left) followed by 2 M NaCl extraction (right). The localization after Triton extraction is indistinguishable from that in untreated cells (compare Figs 3 and 5). After high-salt treatment, plasmid DNA is still detectable but has redistributed into intense foci both inside the nucleus and at the nuclear periphery. (B) COS7 cells were microinjected with the SAR-containing plasmid pMII or the non-SAR control plasmid pK2. Typical nuclei from both injections are shown, without significant difference between the two constructs.
Figure 7
Figure 7
Resistance of transfected plasmid DNA towards high salt. Cells were transfected with three different unlabeled plasmids by electroporation. After 20 h, cells were extracted with Triton X-100 and 2 M NaCl as described in Figure 6 before the remaining plasmids were recovered by the Hirt method. The recovered DNA was quantified by (A) transformation of competent bacteria and counting the number of clones and by real-time PCR (B). According to both quantification methods, and independent of the plasmid, approximately half of the plasmid remained bound after 2 M NaCl extraction (black bars) in comparison with untreated cells (grey bars). Results shown here represent the mean of at least three independent experiments, quantified in duplicate each; normalization to the amount of DNA recovered from untreated cells in the same experiment was performed before calculating the mean to compensate for differences in the absolute amount of recovered DNA.
Figure 8
Figure 8
Plasmid DNA is almost immobile in the nucleus. Eighteen hours after microinjection, the intranuclear mobility of plasmid DNA was determined by fluorescence recovery after photobleaching (FRAP) experiments. (A) A region of interest (yellow rectangle) was bleached with a high-intensity HeNe laser at 543 nm. Images were taken immediately before photobleaching, and the recovery of fluorescence into the bleached area was monitored over time. Shown here is a typical nucleus with 120 s between the individual images. (B) Three different plasmids were investigated and the recovery was quantified from 10 to 20 individual nuclei per construct. Note that the recovery curves are identical, irrespective of the presence or absence of a SAR DNA element or a functional eukaryotic promoter. pMII (green curve), SAR+, promoter–; pEPI-1 (red curve), SAR+, promoter+; pK2 (blue curve), SAR–, promoter–. (C) The measured curve (1) can be described as the sum of a typical first-order recovery curve (2) and a linear component (3), suggesting an exchange between the soluble and immobile fractions. Two different plasmids were analyzed here (green, pMII; purple, pK2). (D) For comparison, the mobility of βGal-NLS and LaminB1 were determined by FRAP as typical examples of a soluble and an immobile nuclear component, respectively.

Similar articles

Cited by

References

    1. Wilson G.L., Dean,B.S., Wang,G. and Dean,D.A. (1999) Nuclear import of plasmid DNA in digitonin-permeabilized cells requires both cytoplasmic factors and specific DNA sequences. J. Biol. Chem., 274, 22025–22032. - PMC - PubMed
    1. Bode J., Goetze,S., Ernst,E., Huesemann,Y., Baer,A., Seibler,J. and Mielke,C. (2003) In Bernardi,G. (ed.), Gene Transfer and Expression in Mammalian Cells. Elsevier, Amsterdam, Vol. 38, pp. 551–572.
    1. Bode J., Benham,C., Knopp,A. and Mielke,C. (2000) Transcriptional augmentation: modulation of gene expression by scaffold/matrix-attached regions (S/MAR elements). Crit. Rev. Eukaryot. Gene Expr., 10, 73–90. - PubMed
    1. Mirkovitch J., Mirault,M.E. and Laemmli,U.K. (1984) Organization of the higher-order chromatin loop: specific DNA attachment sites on nuclear scaffold. Cell, 39, 223–232. - PubMed
    1. Cockerill P.N. and Garrard,W.T. (1986) Chromosomal loop anchorage of the kappa immunoglobulin gene occurs next to the enhancer in a region containing topoisomerase II sites. Cell, 44, 273–282. - PubMed

Publication types