. 2004 Jun;24(11):4720-33.
doi: 10.1128/MCB.24.11.4720-4733.2004.

Disruption of CCTbeta2 expression leads to gonadal dysfunction

Affiliations

Disruption of CCTbeta2 expression leads to gonadal dysfunction

Suzanne Jackowski et al. Mol Cell Biol. 2004 Jun.

Abstract

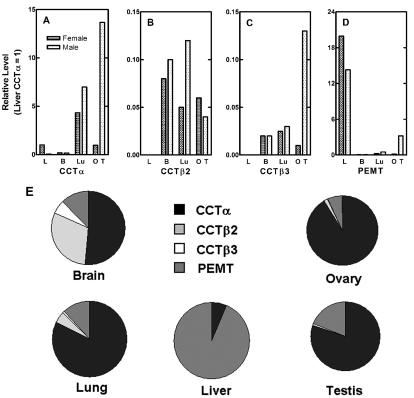
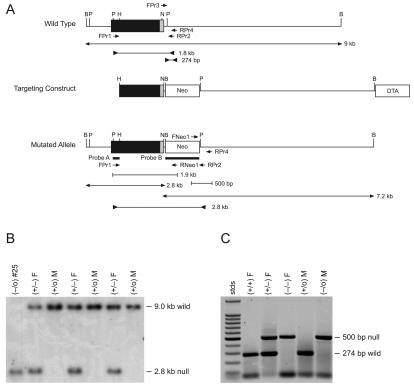
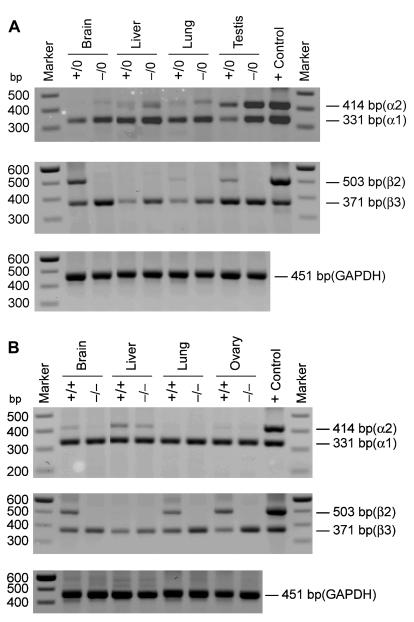
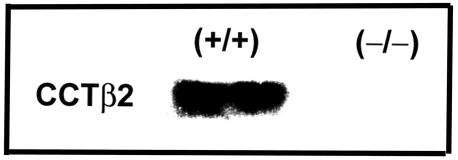
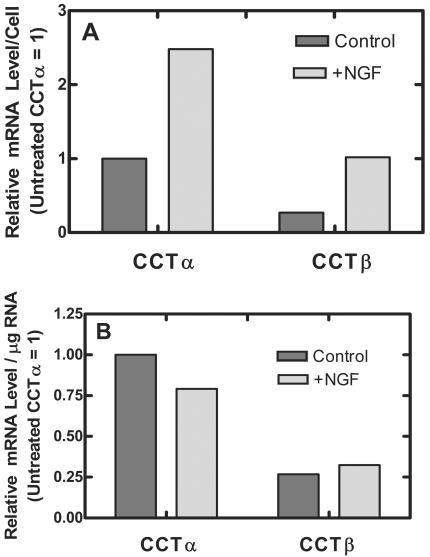
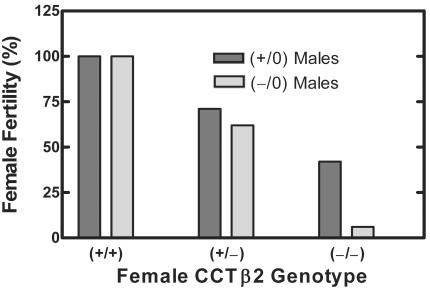
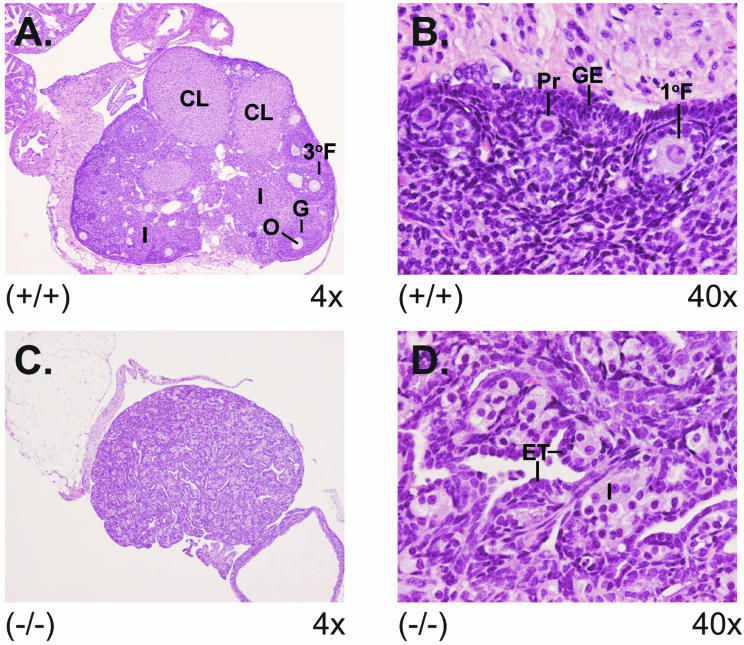
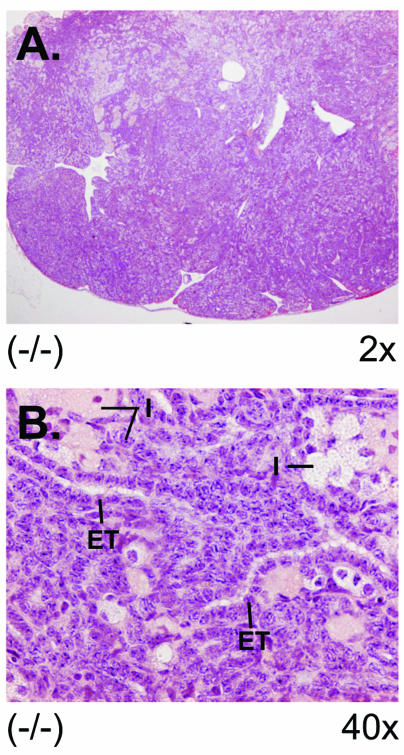
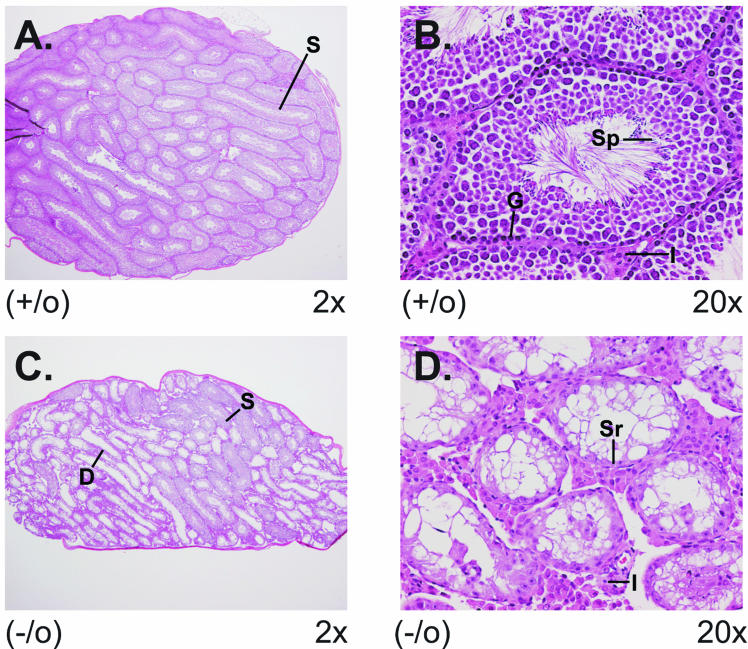
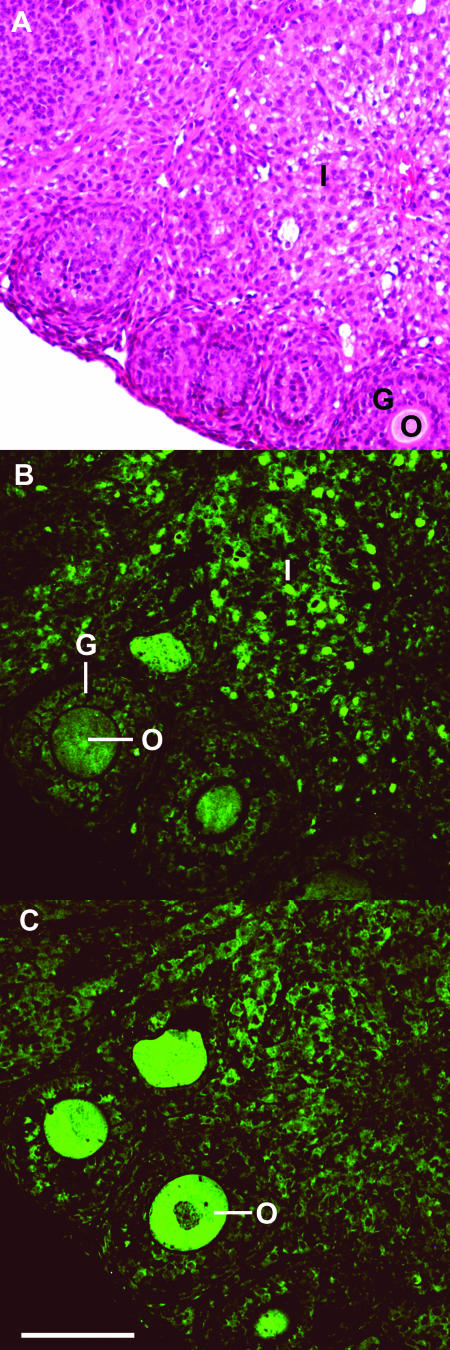
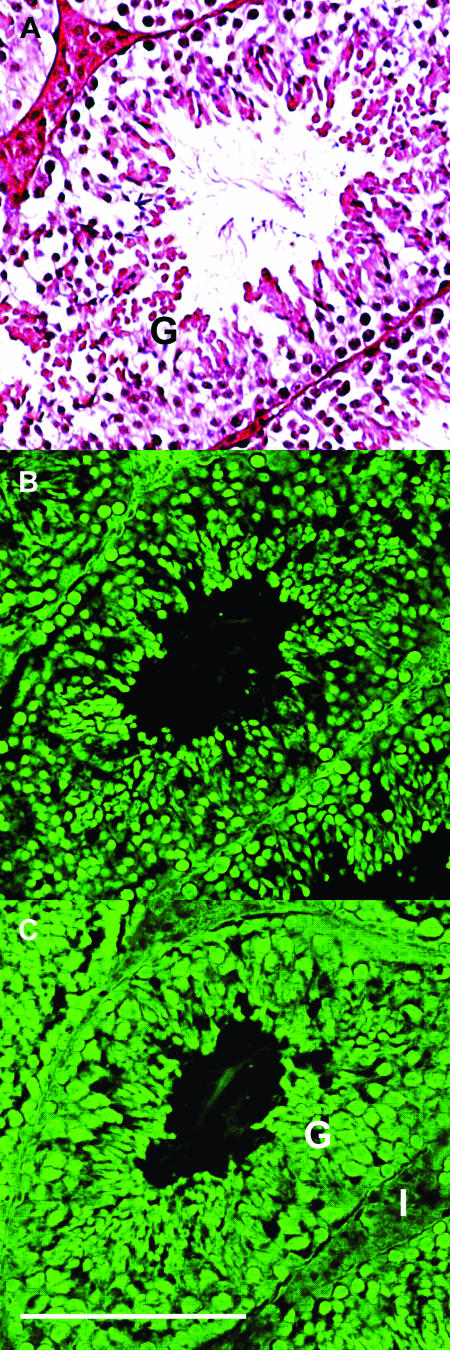
There are two mammalian genes that encode isoforms of CTP:phosphocholine cytidylyltransferase (CCT), a key rate-controlling step in membrane phospholipid biogenesis. Quantitative determination of the CCT transcripts reveals that CCTalpha is ubiquitously expressed and is found at the highest levels in the testis and lung, with lower levels in the liver and ovary. CCTbeta2 is a very minor isoform in most tissues but is significantly expressed in the brain, lung, and gonads. CCTbeta3 is the third isoform recently discovered in mice and is expressed in the same tissues as CCTbeta2, with its highest level in testes. We investigated the role(s) of CCTbeta2 by generating knockout mice. The brains and lungs of mice lacking CCTbeta2 expression did not exhibit any overt defects. On the other hand, a large percentage of the CCTbeta2(-/-) females were sterile and their ovaries exhibited defective ovarian follicle development. The proportion of female CCTbeta2(-/-) mice with defective ovaries increased as the animals aged. The rare litters born from CCTbeta2(-/-) x CCTbeta2(-/0) matings had the normal number of pups. The abnormal ovarian histopathology was characterized by disorganization of the tissue in young adult mice and absence of follicles and ova in older mice, along with interstitial stromal cell hyperplasia which culminated in the emergence of tubulostromal ovarian tumors by 16 months of age. Grossly defective CCTbeta2(-/-) ovaries were associated with high follicle-stimulating (FSH) and luteinizing (LH) hormone levels. Male CCTbeta2(-/0) mice exhibited progressive multifocal testicular degeneration and reduced fertility but had normal FSH and LH levels. Thus, the most notable phenotype of CCTbeta2 knockout mice was gonad degeneration and reproductive deficiency. The results indicate that although CCTbeta2 is expressed at very low levels compared to the alpha-isoform, loss of CCTbeta2 expression causes a breakdown in the gonadal response to hormonal stimulation.


Figures

FIG. 1.
FIG. 1.
Quantitation of the CCT and PEMT transcripts in mouse organs. (A to D) Selected organs were removed from male (hatched bars) and female (stippled bars) wild-type animals, RNA was isolated, and real-time PCR with 0.5 μg of template RNA and the ABI Prism 7700 Sequence Detection System was performed by using primers and probes specific for CCTα (A), CCTβ2 (B), CCTβ3 (C), PEMT (D), and GAPDH transcripts. Liver (L), brain (B), lung (Lu), ovary (O), and testis (T) from at least three mice of each gender were evaluated in quintuplicate and, by using the comparative CT method, the amount of target RNA (2−ΔΔCT) was normalized to the endogenous GAPDH reference (ΔCT) and was related to the amount of target CCTα in liver (ΔΔCT), which was set as the calibrator at 1.0. Standard deviations from the mean ΔCT values (not shown) were <10%. Tissues from both female (stippled bars) and male (cross-hatched bars) mice were analyzed. (E) Distribution of CCT and PEMT transcripts was calculated for individual organs by using data obtained from real-time PCR quantification (shown in panels A to D).
FIG. 2.
FIG. 2.
CCTβ2 targeting construct and analysis of the knockout mouse genotypes. (A) The 9-kb BamHI wild-type genomic clone was obtained from library screening as described in Materials and Methods. The black box indicates the extent of exon 2, and the gray zone is the coding portion of the exon. The targeting construct inserts the Neo resistance gene into exon 2 at the NcoI site, eliminating part of the CCTβ2 coding sequence. The DTA gene was inserted at one end of the vector for counterselection of recombinant clones. The structure of the mutated allele after the integration of the Neo gene by homologous recombination is shown on the last line. Probes A and B were used for Southern blotting, which detected the bands with outward-pointing arrows. Bands detected by PCR as described in Materials and Methods are indicated by the inward-pointing arrows. Restriction enzymes are abbreviated as follows: B, BamHI; P, PstI; H, HindIII; and N, NcoI. (B) An example of Southern blot analysis of mouse genomic DNA. Genomic DNA was isolated and digested with BamHI, and the fragments were separated by agarose gel electrophoresis. The blot was probed with 32P-labeled probe A, a PstI-HindIII fragment located outside of the targeting construct. The wild-type allele is revealed by hybridization with a 9-kb band, whereas the mutant allele gives a 2.8-kb band due to the presence of a new BamHI site within the inserted Neo gene. Sample #25 is the ES cell clone used for the blastocyst injections. Probe B was used in Southern blot experiments to detect the presence of the 7.2-kb Neo gene fragment in the BamHI digest to confirm the genotype the mice (data not shown). (C) An example of the PCR analysis used to genotype mice. A multiplex PCR consisting of a mixture of primers FPr3, FNeo1, and RPr4 were used to signal either the 274-bp wild-type allele or the 500-bp null allele. PCRs used to screen the ES cell clones consisted of FPr1 coupled with RPr2 or RNeo1 to give a 1.8-kb band in the wild-type cells and a 2.8-kb band in the mutant cells (data not shown).
FIG. 3.
FIG. 3.
Expression of CCTα and CCTβ mRNAs in tissues from male and female wild-type and CCTβ2-deficient mice. Tissues were removed from male (A) and female (B) animals with the indicated genotypes, RNA was isolated, and the samples (10 μg) were screened by using multiplex PCR to detect the two CCTα and two CCTβ mRNAs as described in Materials and Methods. The CCTα1 mRNA was detected as a 331-bp product, and CCTα2 was a 414-bp product. The presence of CCTβ2 was detected by a 503-bp band, and CCTβ3 yielded a 331-bp product. The control primer pair signaled a 451-bp fragment of the GAPDH mRNA.
FIG. 4.
FIG. 4.
Immunoblot analysis of CCTβ2 protein expression. Western blotting was performed by using mouse brain tissue. Wild-type (+/+) and knockout (−/−) female brains were homogenized and separated on 8% NuPAGE gels prior to blotting with a CCTβ isoform-specific antibody (32). CCTβ2 migrates at a molecular size of 42 kDa.
FIG. 5.
FIG. 5.
CCT expression in PC12 cells. PC12 cells were cultured with NGF (100 ng/ml) or alone for 5 days in duplicate 100-mm-diameter dishes in two independent experiments. Total RNA was isolated from each culture and quantified, and the relative amounts of CCTα, CCTβ2, and CCTβ3 transcripts per microgram of RNA were determined in quintuplicate by using real-time PCR as described in Materials and Methods. The amount of target RNA (2ΔΔCT) was normalized to the endogenous GAPDH reference (ΔCT) and was related to the amount of target CCTα in untreated control cultures (ΔΔCT), which was set as the calibrator at 1.0. The averages of three sets of determinations are reported for CCTα, and the averages of two sets of determinations are reported for CCTβ2 and CCTβ3. Standard deviations from the mean ΔCT values (not shown) were <10%. Cell numbers and protein determinations were measured by using duplicate parallel cultures. (A) Data normalized to number of cells; (B) data normalized to micrograms of total RNA.
FIG. 6.
FIG. 6.
Fertility of CCTβ2−/− females. Female mice (2 to 4 months old) with the indicated genotypes were paired 1:1 with either wild-type or CCTβ2−/0 males as indicated for 2 months and were scored as fertile if they were pregnant or had borne pups at least once by the end of that time period. Comparison of the mating groups was done by the Fisher exact test. For CCTβ2+/+ × CCTβ2+/0 (n = 27) compared to CCTβ2−/− × CCTβ2+/0 (n = 19), P < 0.001; for CCTβ2−/− × CCTβ2+/0 (n = 19) compared to CCTβ2−/− × CCTβ2−/0 (n = 16), P = 0.022; for CCTβ2+/+ × CCTβ2−/0 (n = 6) compared to CCTβ2−/− × CCTβ2−/0 (n = 16), P < 0.001; for CCTβ2+/+ × CCTβ2+/0 or CCTβ2−/0 (n = 30) compared to CCTβ2+/− × CCTβ2+/0 or CCTβ2−/0 (n = 36), P < 0.001.
FIG. 7.
FIG. 7.
Aberrant ovary morphology in CCTβ2−/− mice. The ovaries from wild-type and CCTβ2−/− knockout mice were removed, fixed, and stained for pathology analysis. (A) View (magnification, ×4) of a normal ovary showing developing follicles and multiple corpora lutea. Structures indicated are the following: 3°F, tertiary follicle with ovum; O, ovum; G, granulosa cells; CL, corpus luteum; and I, interstitial stromal tissue. (B) View (magnification, ×40) of a normal ovary showing the following: Pr, primordial follicle with ovum; 1°F, a primary follicle with ovum surrounded by a layer of granulosa cells; and GE, organized germinal epithelial cell layer. (C) View (magnification, ×4) of a CCTβ2−/− knockout ovary illustrating the absence of ova, follicles, and corpora lutea. (D) View (magnification, ×40) of a CCTβ2−/− ovary showing hyperplastic epithelial cells, invaginating into and dissecting the interstitial stromal cell tissue forming epithelial tubules (ET) and cords of interstitial stromal cells with foamy cytoplasm (I).
FIG. 8.
FIG. 8.
Ovarian tumor derived from an aged CCTβ2−/− mouse. (A) View (magnification, ×2) of an ovary from age 16 months, showing epithelial, tubular, and interstitial components of tubulostromal tumor lacking ova, follicles, or corpora lutea. (B) View (magnification, ×40) of the tumor showing disorganized morphology with epithelial tubules (ET) and interstitial stromal cells with eosinophilic, foamy, or brown-gold cytoplasm dispersed between the tubules (I).
FIG. 9.
FIG. 9.
Aberrant testis morphology in CCTβ2−/0 mice. The testes from 6-month-old CCTβ2−/0 knockout mice and wild-type littermate controls were removed, fixed, and stained for pathology analysis. (A) View (magnification, ×2) of a wild-type testis showing seminiferous tubules with small lumens (S). (B) View (magnification, ×20) of testis showing seminiferous tubules with 4 to 5 germinal cell layers composed of spermatogonia and Sertoli cells and spermatogenesis progressing from the basal germinal layer (G) to mature spermatids (S) with their tails extending into the lumen. Interstitial Leydig cells (I) are located in the space between the seminiferous tubules. (C) View (magnification, ×2) of a CCTβ2−/0 knockout testis illustrating multiple foci of degenerate seminiferous tubules with a large lumen (D) and also normal seminiferous tubules with a small lumen (S). (D) View (magnification, ×20) of a CCTβ2−/0 knockout testis showing multiple small degenerative seminiferous tubules with reduced number of germinal cell layers and absence of spermatozoa. Sertoli cells (Sr) are the predominant cells associated with the basal germinal layer, and interstitial Leydig cells (I) are increased between the tubules.
FIG. 10.
FIG. 10.
Fluorescent immunocytochemistry of CCT expression in ovary. Wild-type C57BL/6J × 129J ovary (age, 4 months) was fixed and stained with hematoxylin and eosin (A), rabbit anti-mouse CCTα antibody (B), or rabbit anti-human CCTβ antibody (C), followed by goat anti-rabbit Alexa Fluor 488-coupled secondary IgG (H + L). Substitution of preimmune rabbit serum for the primary antibody did not yield a fluorescent image at the same exposure. Structures indicated are the following: I, interstitial stromal cells; O, ova; and G, granulosa cells. CCTα is most highly expressed in the nuclei of the interstitial stromal cells (B), whereas CCTβ is more highly expressed in the ova (C). Scale bar, 0.1 mm.
FIG. 11.
FIG. 11.
Fluorescent immunocytochemistry of CCT expression in testis. Wild-type 129/Sv × C57BL/6J testis (age, 4 months) was fixed and stained with hematoxylin and eosin (A), rabbit anti-mouse CCTα antibody (B), or rabbit anti-human CCTβ antibody (C), followed by goat anti-rabbit Alexa Fluor 488-coupled secondary IgG (H + L). Substitution of preimmune rabbit serum for the primary antibody did not yield a fluorescent image at the same exposure. Structures indicated are the following: G, seminiferous tubules and germinal cell layers; I, interstitial Leydig cells. CCTα is expressed in the seminiferous and germinal cell layers (B), and CCTβ is expressed in the same cell populations and at lower intensity in the interstitial Leydig cells (C). Scale bar, 0.1 mm.

Similar articles

Cited by

References

    1. Araki, W., and R. J. Wurtman. 1997. Control of membrane phosphatidylcholine biosynthesis by diacylglycerol levels in neuronal cells undergoing neurite outgrowth. Proc. Natl. Acad. Sci. USA 94:11946-11950. - PMC - PubMed
    1. Arnold, R. S., and R. B. Cornell. 1996. Lipid regulation of CTP:phosphocholine cytidylyltransferase: electrostatic, hydrophobic, and synergistic interactions of anionic phospholipids and diacylglycerol. Biochemistry 35:9917-9924. - PubMed
    1. Arnold, R. S., A. A. DePaoli-Roach, and R. B. Cornell. 1997. Binding of CTP:phosphocholine cytidylyltransferase to lipid vesicles: diacylglycerol and enzyme dephosphorylation increase the affinity for negatively charged membranes. Biochemistry 36:6149-6156. - PubMed
    1. Attard, G. S., R. H. Templer, W. S. Smith, A. N. Hunt, and S. Jackowski. 2000. Modulation of CTP:phosphocholine cytidylyltransferase by membrane curvature elastic stress. Proc. Natl. Acad. Sci. USA 97:9032-9036. - PMC - PubMed
    1. Baburina, I., and S. Jackowski. 1999. Cellular responses to excess phospholipid. J. Biol. Chem. 274:9400-9408. - PubMed

Publication types

Substances