

Promoter-dependent mechanism leading to selective hypomethylation within the 5' region of gene MAGE-A1 in tumor cells
- PMID: 15143172
- PMCID: PMC416434
- DOI: 10.1128/MCB.24.11.4781-4790.2004
Promoter-dependent mechanism leading to selective hypomethylation within the 5' region of gene MAGE-A1 in tumor cells
Abstract
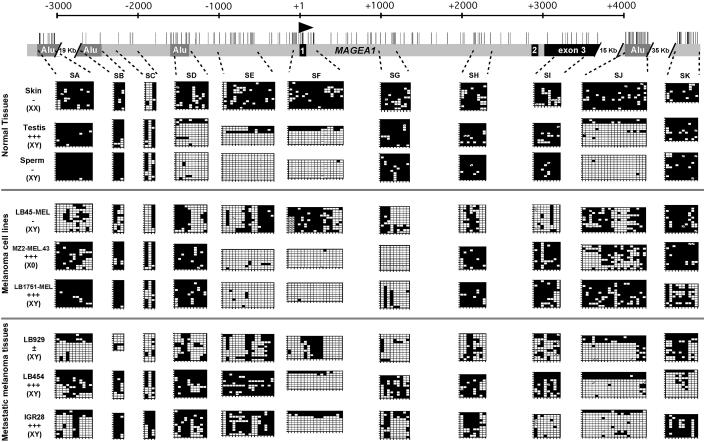
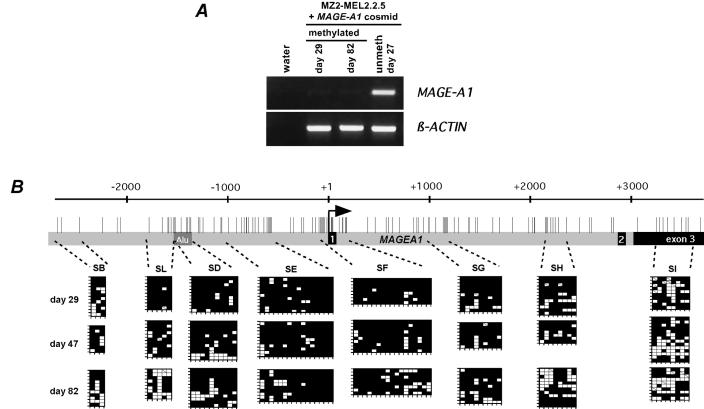
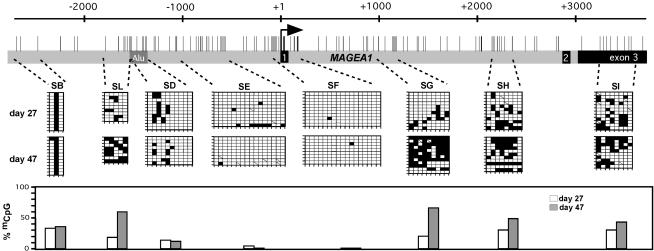
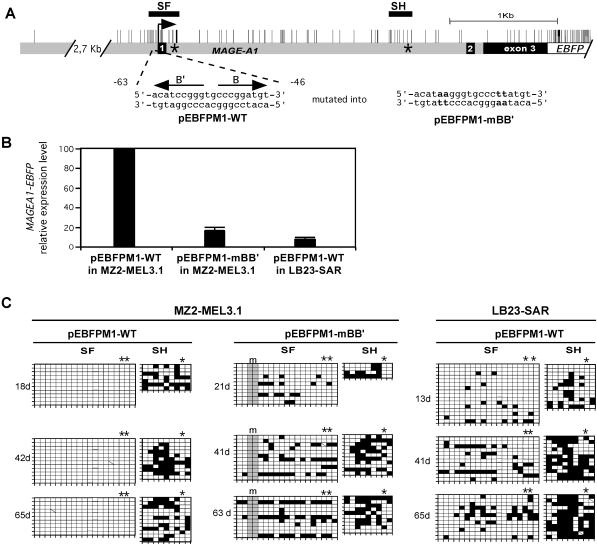
Several male germ line-specific genes, including MAGE-A1, rely on DNA methylation for their repression in normal somatic tissues. These genes become activated in many types of tumors in the course of the genome-wide demethylation process which often accompanies tumorigenesis. We show that in tumor cells expressing MAGE-A1, the 5' region is significantly less methylated than the other parts of the gene. The process leading to this site-specific hypomethylation does not appear to be permanent in these tumor cells, since in vitro-methylated MAGE-A1 sequences do not undergo demethylation after being stably transfected. However, in these cells there is a process that inhibits de novo methylation within the 5' region of MAGE-A1, since unmethylated MAGE-A1 transgenes undergo remethylation at all CpGs except those located within the 5' region. This local inhibition of methylation appears to depend on promoter activity. We conclude that the site-specific hypomethylation of MAGE-A1 in tumor cells relies on a transient process of demethylation followed by a persistent local inhibition of remethylation due to the presence of transcription factors.
Figures

Similar articles
-
Transient down-regulation of DNMT1 methyltransferase leads to activation and stable hypomethylation of MAGE-A1 in melanoma cells.J Biol Chem. 2006 Apr 14;281(15):10118-26. doi: 10.1074/jbc.M510469200. Epub 2006 Feb 22. J Biol Chem. 2006. PMID: 16497664
-
Conditional expression of the CTCF-paralogous transcriptional factor BORIS in normal cells results in demethylation and derepression of MAGE-A1 and reactivation of other cancer-testis genes.Cancer Res. 2005 Sep 1;65(17):7751-62. doi: 10.1158/0008-5472.CAN-05-0858. Cancer Res. 2005. PMID: 16140943
-
DNA methylation is the primary silencing mechanism for a set of germ line- and tumor-specific genes with a CpG-rich promoter.Mol Cell Biol. 1999 Nov;19(11):7327-35. doi: 10.1128/MCB.19.11.7327. Mol Cell Biol. 1999. PMID: 10523621 Free PMC article.
-
DNA hypomethylation in cancer: epigenetic scars of a neoplastic journey.Epigenetics. 2010 Apr;5(3):206-13. doi: 10.4161/epi.5.3.11447. Epub 2010 Apr 1. Epigenetics. 2010. PMID: 20305381 Review.
-
Hypomethylation: one side of a larger picture.Ann N Y Acad Sci. 2003 Mar;983:28-42. doi: 10.1111/j.1749-6632.2003.tb05960.x. Ann N Y Acad Sci. 2003. PMID: 12724210 Review.
Cited by
-
Immunomodulatory action of the DNA methyltransferase inhibitor SGI-110 in epithelial ovarian cancer cells and xenografts.Epigenetics. 2015;10(3):237-46. doi: 10.1080/15592294.2015.1017198. Epigenetics. 2015. PMID: 25793777 Free PMC article.
-
A novel cancer-germline transcript carrying pro-metastatic miR-105 and TET-targeting miR-767 induced by DNA hypomethylation in tumors.Epigenetics. 2014 Aug;9(8):1163-71. doi: 10.4161/epi.29628. Epub 2014 Jul 8. Epigenetics. 2014. PMID: 25089631 Free PMC article.
-
Resveratrol acts via melanoma-associated antigen A12 (MAGEA12)/protein kinase B (Akt) signaling to inhibit the proliferation of oral squamous cell carcinoma cells.Bioengineered. 2021 Dec;12(1):2253-2262. doi: 10.1080/21655979.2021.1934242. Bioengineered. 2021. PMID: 34085601 Free PMC article.
-
Genome-wide comparative methylation analysis reveals the fate of germ stem cells after surrogate production in teleost.BMC Biol. 2024 Feb 16;22(1):39. doi: 10.1186/s12915-024-01842-z. BMC Biol. 2024. PMID: 38360607 Free PMC article.
-
Methylation of multiple genes in gastric glands with intestinal metaplasia: A disorder with polyclonal origins.Am J Pathol. 2006 Nov;169(5):1643-51. doi: 10.2353/ajpath.2006.060552. Am J Pathol. 2006. PMID: 17071588 Free PMC article.
References
-
- Antequera, F., J. Boyes, and A. Bird. 1990. High levels of de novo methylation and altered chromatin structure at CpG islands in cell lines. Cell 62:503-514. - PubMed
-
- Baylin, S. B., J. G. Herman, J. R. Graff, P. M. Vertino, and J. P. Issa. 1998. Alterations in DNA methylation: a fundamental aspect of neoplasia. Adv. Cancer Res. 72:141-196. - PubMed
-
- Bird, A. 2002. DNA methylation patterns and epigenetic memory. Genes Dev. 16:6-21. - PubMed
-
- Brandeis, M., D. Frank, I. Keshet, Z. Siegfried, M. Mendelsohn, A. Nemes, V. Temper, A. Razin, and H. Cedar. 1994. Sp1 elements protect a CpG island from de novo methylation. Nature 371:435-438. - PubMed
-
- Brasseur, F., D. Rimoldi, D. Lienard, B. Lethe, S. Carrel, F. Arienti, L. Suter, R. Vanwijck, A. Bourlond, Y. Humblet, et al. 1995. Expression of MAGE genes in primary and metastatic cutaneous melanoma. Int. J. Cancer 63:375-380. - PubMed
Publication types
MeSH terms
Substances
LinkOut - more resources
Full Text Sources
Other Literature Sources