. 2004 Jun;24(11):5005-15.
doi: 10.1128/MCB.24.11.5005-5015.2004.

Overexpression of the ped/pea-15 gene causes diabetes by impairing glucose-stimulated insulin secretion in addition to insulin action

Affiliations

Overexpression of the ped/pea-15 gene causes diabetes by impairing glucose-stimulated insulin secretion in addition to insulin action

Giovanni Vigliotta et al. Mol Cell Biol. 2004 Jun.

Abstract

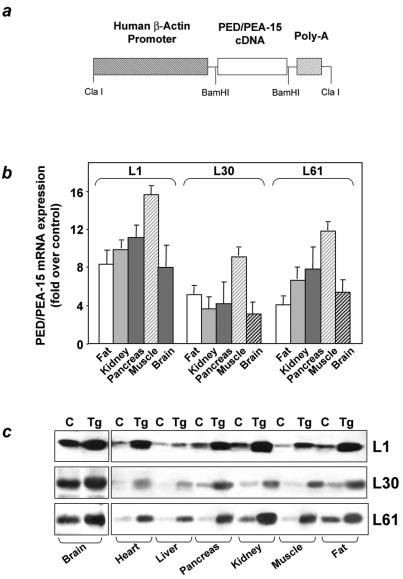
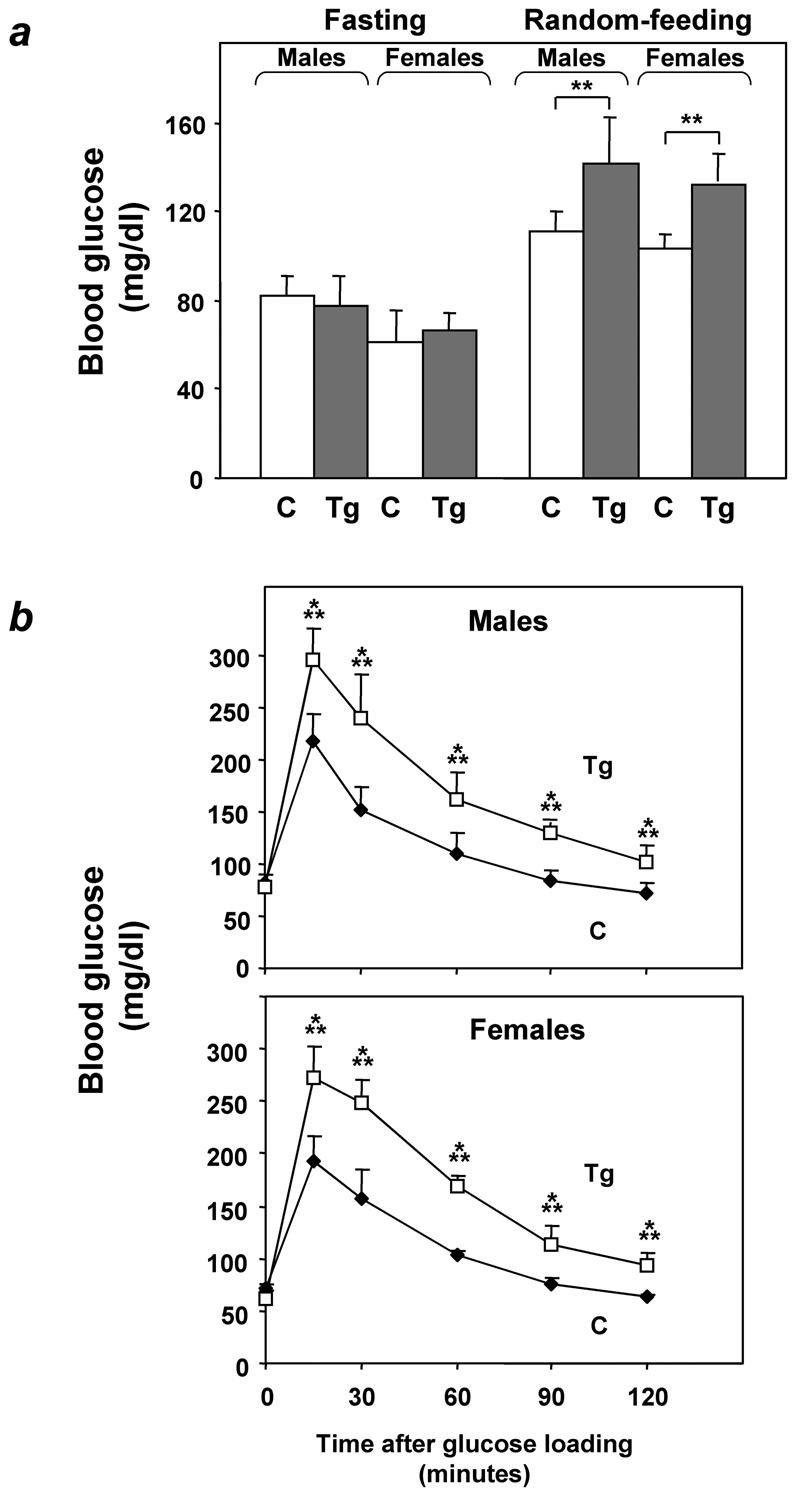
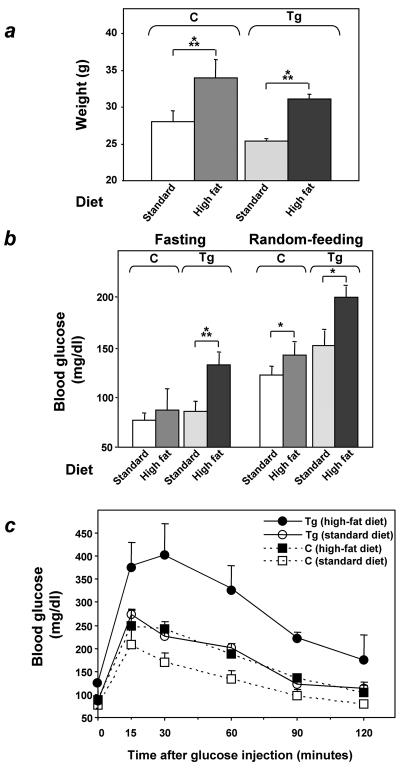
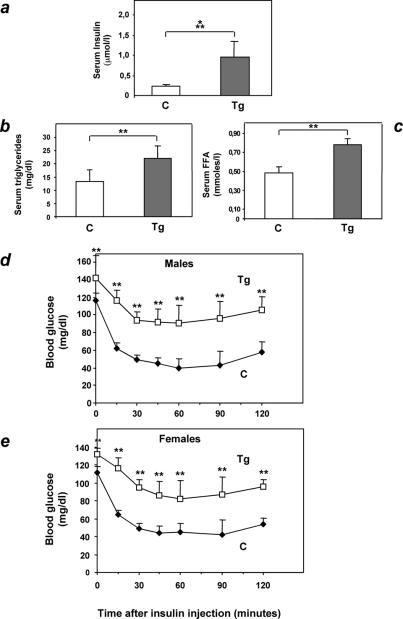
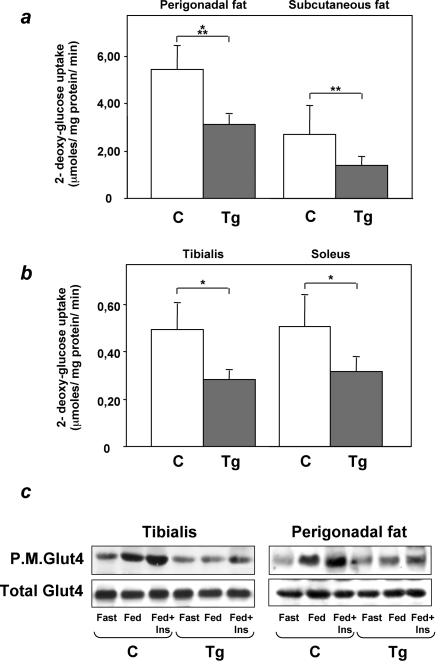
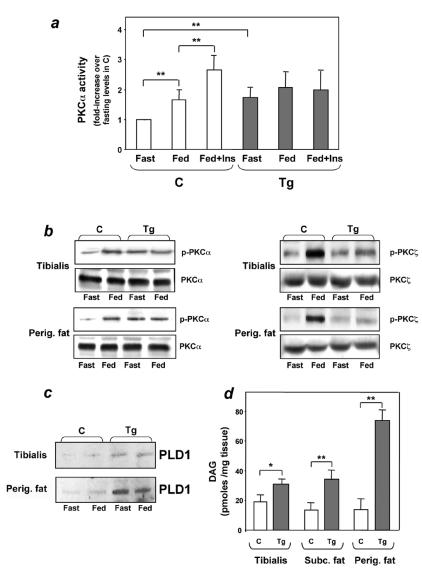
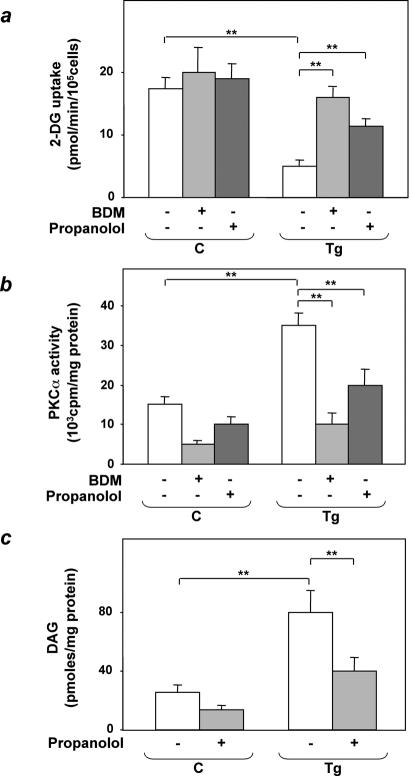
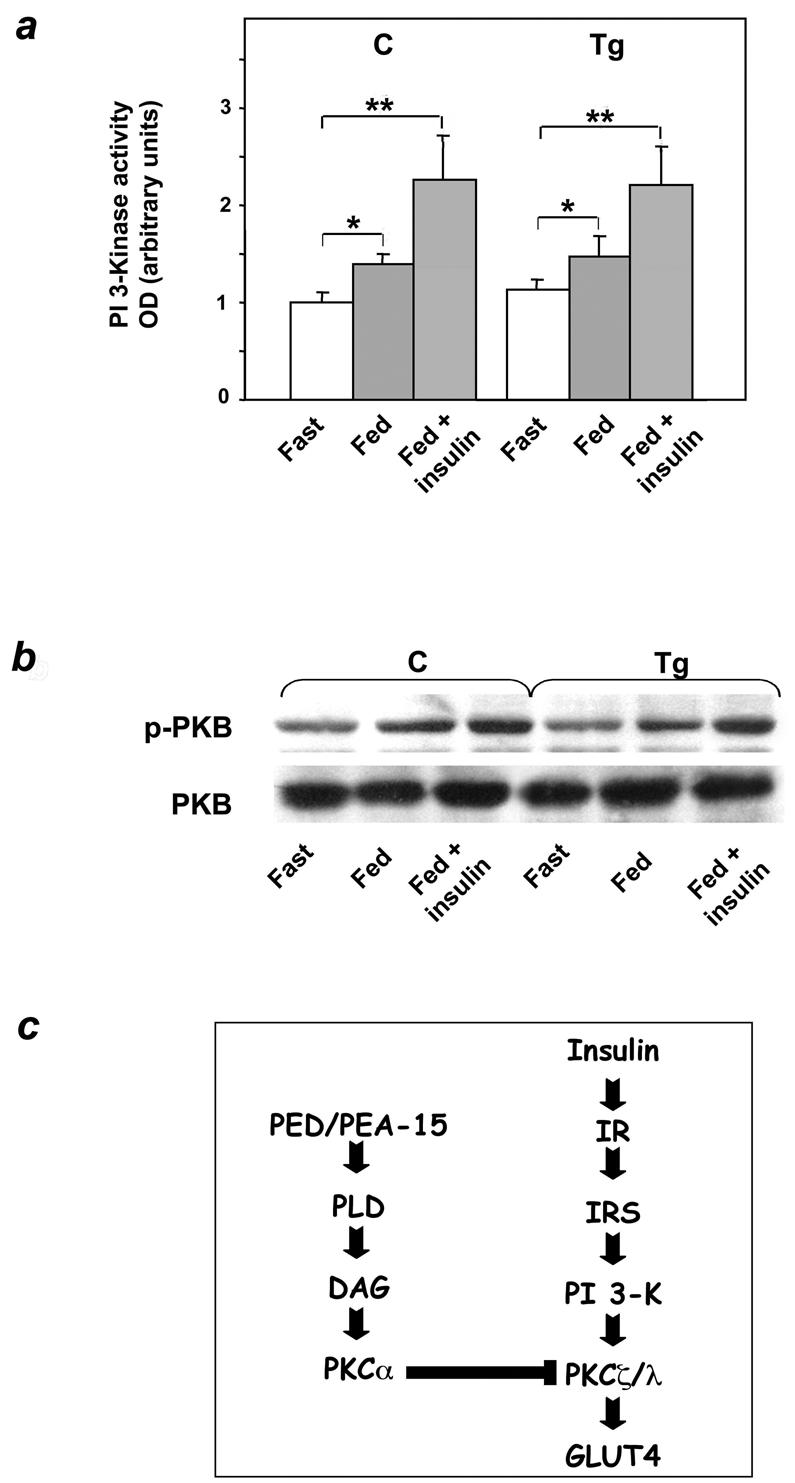
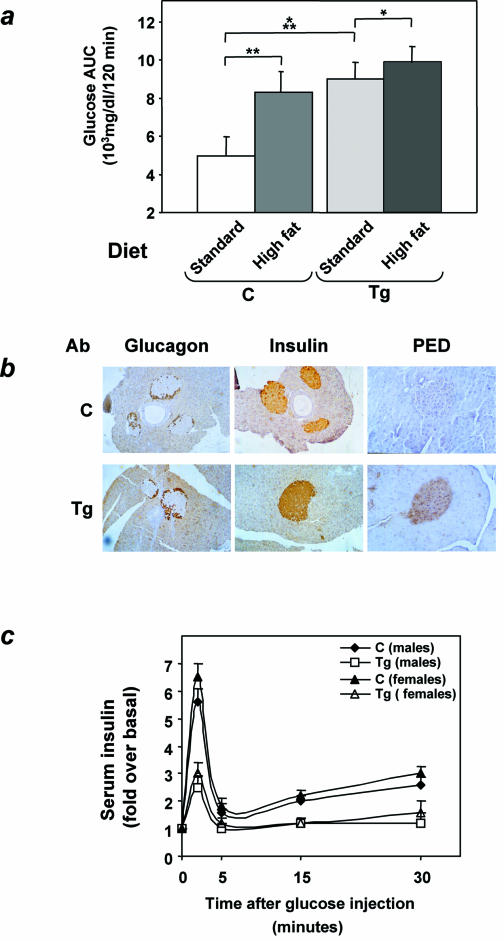
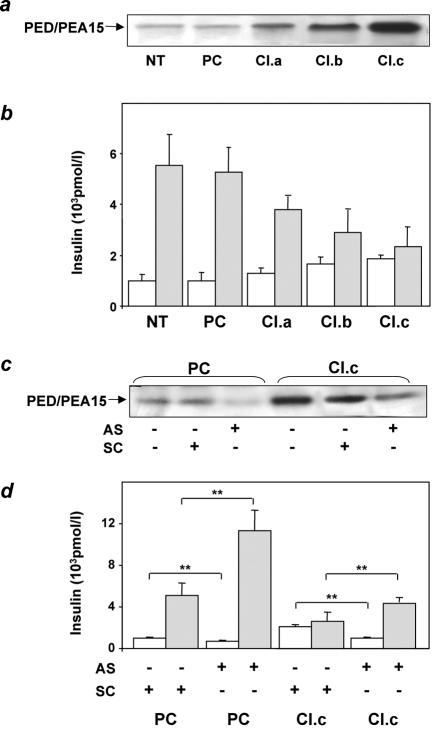
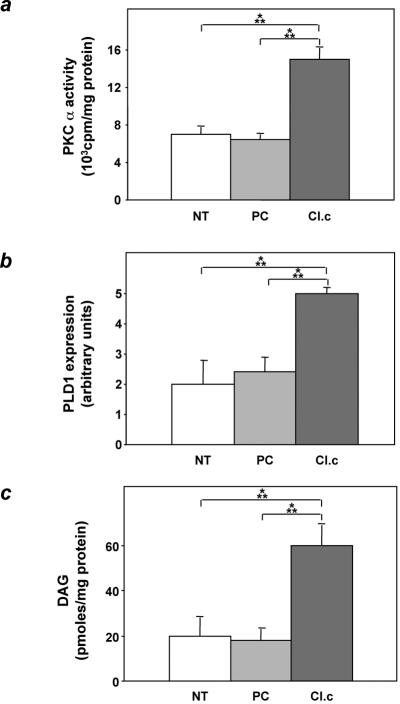
Overexpression of the ped/pea-15 gene is a common feature of type 2 diabetes. In the present work, we show that transgenic mice ubiquitously overexpressing ped/pea-15 exhibited mildly elevated random-fed blood glucose levels and decreased glucose tolerance. Treatment with a 60% fat diet led ped/pea-15 transgenic mice to develop diabetes. Consistent with insulin resistance in these mice, insulin administration reduced glucose levels by only 35% after 45 min, compared to 70% in control mice. In vivo, insulin-stimulated glucose uptake was decreased by almost 50% in fat and muscle tissues of the ped/pea-15 transgenic mice, accompanied by protein kinase Calpha activation and block of insulin induction of protein kinase Czeta. These changes persisted in isolated adipocytes from the transgenic mice and were rescued by the protein kinase C inhibitor bisindolylmaleimide. In addition to insulin resistance, ped/pea-15 transgenic mice showed a 70% reduction in insulin response to glucose loading. Stable overexpression of ped/pea-15 in the glucose-responsive MIN6 beta-cell line also caused protein kinase Calpha activation and a marked decline in glucose-stimulated insulin secretion. Antisense block of endogenous ped/pea-15 increased glucose sensitivity by 2.5-fold in these cells. Thus, in vivo, overexpression of ped/pea-15 may lead to diabetes by impairing insulin secretion in addition to insulin action.


Figures

FIG. 1.
FIG. 1.
Generation of ped/pea-15 transgenic mice. a. Subcloning of the ped/pea-15 cDNA in the BamHI sites of plasmid pBap2 containing the β-actin promoter. Tissues from ped/pea-15 transgenic mice (Tg) and their nontransgenic littermates (C) were collected as described under Materials and Methods and subjected to Northern (b) or Western (c) blotting. Northern blots (25 μg of RNA/lane) were probed with ped/pea-15 cDNA as reported (6). Loading of the same amount of RNA in each lane was ensured by further blotting for β-actin. Quantitation of the blots was performed by densitometric analysis. Data are plotted as increase of ped/pea-15 mRNA expression in transgenic versus control mice. Bars represent the means ± standard deviation of comparisons in five transgenic and five nontransgenic animals. For Western blotting, tissues from control and transgenic mice (L1, L30, and L6 lines) were solubilized, and lysates (100 μg of protein/lane) were blotted with PED/PEA-15 antiserum (6), followed by chemiluminescence and autoradiography. Three representative experiments are shown.
FIG. 2.
FIG. 2.
Glucose tolerance in ped/pea-15 transgenic mice. (a) ped/pea-15 transgenic mice (Tg) and their nontransgenic littermates (C) were either fasted for 12 h or fed ad libitum (random feeding). Blood glucose levels were then determined as described under Materials and Methods. Bars represent the mean ± standard deviation of determinations in at least 10 mice in each group. The differences in fasting glucose levels between transgenic and control mice were not statistically significant. Alternatively (b), whole-blood glucose was determined at 0 to 120 min after intraperitoneal glucose injection (2 mg kg−1) of age-matched male (top panel) and female (bottom panel) transgenic and control mice after overnight fasting. Values are expressed as mean ± standard deviation for at least 12 mice in each group. Asterisks denote statistically significant differences (**, P < 0.01; ***, P < 0.001).
FIG. 3.
FIG. 3.
Effect of high-fat feeding on glucose tolerance in ped/pea-15 transgenic mice. Three-month-old female transgenic (Tg) and control (C; nontransgenic littermates) mice were fed either standard (10% fat) or 60% fat diets for 10 weeks. Animals were then weighed (a), and blood glucose levels were determined (b) after overnight fasting and in random-fed animals. Bars represent the mean ± standard deviation of values from at least 10 mice in each group. The differences in fasting blood glucose levels in control mice treated with standard or high-fat diets were not statistically significant. Asterisks denote statistically significant differences (*, P < 0.05; ***, P < 0.001). Alternatively (c), glucose tolerance was compared in weight-matched female transgenic and control animals (at least 10 animals/group) subjected to the two different diets, as outlined in the legend to Fig. 2. Differences in blood glucose levels after high-fat diet treatment were significant at P < 0.001 (transgenic mice) and P < 0.06 (control mice).
FIG. 4.
FIG. 4.
Insulin sensitivity in ped/pea-15 transgenic mice. Three-month old female ped/pea-15 transgenic mice and age-matched nontransgenic littermates (16 per group) were fasted for 12 h, followed by determination of insulin (a), triglycerides (b), and free fatty acid (c) levels in plasma as described under Materials and Methods. Bars represent the mean ± standard deviation of duplicate determinations in each animal. Differences between transgenic and control mice were significant at P < 0.001 (serum insulin) and P < 0.01 (serum free fatty acids and triglycerides). Alternatively, random-fed male (d) or female (e) mice (n = 12/group) were injected intraperitoneally with insulin (0.75 mU g−1), followed by determinations of blood glucose levels at the indicated times. Values are expressed as mean ± standard deviation of duplicate determinations in each animal. Asterisks denote statistically significant differences (P < 0.01).
FIG. 5.
FIG. 5.
Glucose transport in ped/pea-15 transgenic mice. (a) Weight-matched female transgenic (Tg; n = 6) and control (C; n = 6) mice were subjected to intraperitoneal injection of d-[1,2-3H]glucose (2g kg of body weight−1; 10 μCi/mouse) and insulin (0.75 mU g of body weight−1) and killed, and tissues were snap-frozen in liquid nitrogen. d-[1,2-3H]glucose-6-phosphate accumulated in muscle and fat tissues was quantitated as described under Materials and Methods. Bars represent mean values ± standard deviations. Differences between control and transgenic animals were significant at P < 0.05 (tibialis and soleus muscles), P < 0.01 (subcutaneous fat), and P < 0.001 (perigonadal fat). (b) Alternatively, tissues from insulin-injected animals were frozen in liquid nitrogen and harvested for plasma membrane preparation as described under Materials and Methods. Total homogenates and plasma membrane lysates were then analyzed by Western blotting with GLUT4 antibodies. Blots were revealed by enhanced chemiluminescence and autoradiography. The autoradiographs shown are representative of four independent experiments.
FIG. 6.
FIG. 6.
PKCα activation in ped/pea-15 transgenic mice. (a) Weight-matched female mice were fasted overnight or fed ad libitum, followed by intraperitoneal insulin injection (0.75 mU g−1 body weight), as indicated. The animals were killed, and perigonadal fat tissue was collected, homogenized, and immunoprecipitated with PKCα antibodies. PKC activity was assayed in the immunoprecipitates as outlined under Materials and Methods. Bars represent the mean ± standard deviation of data from at least seven mice per group. Asterisks denote statistically significant differences (P < 0.01). Alternatively, fat or muscle tissues were solubilized, and lysates were Western blotted with phospho-PKC (P-PKC), PKC (panel b), or phospholipase D 1(PLD1) antibodies (panel c). Bands were revealed by enhanced chemiluminescence and autoradiography. The autoradiographs shown are representative of four (PKCα and phospholipase D 1) and three (PKCζ) independent experiments. (d) For determining diacylglycerol levels, tissues were extracted in chloroform-methanol, and lipid extracts were assayed by adding diacylglycerol kinase and [γ-32P]ATP as described under Materials and Methods. [32P]phosphatidic acid was separated by thin-layer chromatography and quantitated by liquid scintillation counting. Bars represent the mean ± standard deviation of data from at least six mice per group. Asterisks denote statistically significant differences (*P < 0.05, **P < 0.01).
FIG. 7.
FIG. 7.
Bisindolylmaleimide and propanolol effects on 2-deoxyglucose uptake in epididymal fat adipocytes from ped/pea-15 transgenic mice. Adipocytes from transgenic (Tg) and control (C) mice were incubated with 100 nM bisindolylmaleimide (BDM) or 150 μM propanolol for 30 min, as indicated; 100 nM insulin (final concentration) was then added, and the cells were assayed for 2-deoxyglucose uptake (a). Lysates of adipocytes from transgenic and control mice were immunoprecipitated with PKCα antibodies, followed by determination of PKC activity (b), as described under Materials and Methods. Alternatively, the cells were extracted and diacylglycerol (DAG) levels were determined as described under Materials and Methods (c). Bars represent the means ± standard deviation of duplicate determinations in four (2-deoxyglucose uptake), three (PKCα activity), and five (diacylglycerol levels) independent experiments with fat pads from five transgenic and five control mice. Asterisks denote statistically significant differences (**, P < 0.001).
FIG. 8.
FIG. 8.
Activation of phosphatidylinositol 3-kinase and Akt in ped/pea-15 transgenic mice. (a) Weight-matched female mice were fasted overnight or fed ad libitum, followed by intraperitoneal insulin injection (0.75 mU g of body weight−1), as indicated. Animals were sacrificed, and the tibialis muscles were collected, homogenized, and assayed for phosphatidylinositol (PI) 3-kinase activity as described under Materials and Methods. Bars represent the mean ± standard deviation of data from five mice per group. The difference in insulin-induced PKB in transgenic versus control mice was not statistically significant. (b) Alternatively, tissue lysates were Western blotted with either PKB or phospho-PKB antibodies. Filters were revealed by enhanced chemiluminescence and autoradiography. The autoradiographs shown are representative of four independent experiments. (c) Proposed mechanism of PED action on insulin-stimulated glucose transport (details in the text). Asterisks denote statistically significant differences (*, P < 0.05; **, P < 0.01).
FIG. 9.
FIG. 9.
Insulin secretion in ped/pea-15 transgenic mice. (a) Transgenic (Tg) and control (C) female mice were fed either a 10% fat standard or a 60% high-fat diet for 10 weeks. Weight-matched animals were then subjected to intraperitoneal insulin tolerance tests as outlined in the legend to Fig. 4. The effect of the high-fat diet on insulin tolerance is expressed as total areas under the curve (glucose AUC). Bars represent the mean ± standard deviation of data from seven mice per group. Asterisks denote statistically significant differences versus mice maintained on the standard diet (*, P < 0.05; **, P < 0.01; ***, P < 0.001). (b) Overexpression of ped/pea-15 in pancreas from ped/pea-15 transgenic mice. Pancreas from ped/pea-15 male transgenic mice (Tg) and their nontransgenic littermates (C) were fixed and embedded in Tissue-Tek OTC, and sections were prepared as described under Materials and Methods. Immunohistochemical analysis of the islets was carried out with PED/PEA-15, insulin, and glucagon antibodies as indicated. Anti-rabbit or anti-goat immunoglobulin G was used as the second antibody. Immunoreactivity was revealed by peroxidase-labeled streptavidin. The microphotographs shown are representative of images obtained from eight transgenic (four male and four female) and seven nontransgenic mice (three male and four female). (c) Weight-matched transgenic and control mice were subjected to intraperitoneal glucose loading as outlined in the legend to Fig. 2, followed by determination of plasma insulin levels at the indicated times. Data points represent the mean ± standard deviation of determinations in 14 transgenic (seven female and seven male) and 16 control mice (eight female and eight male). Differences between control and transgenic mice were statistically significant, as indicated in the text.
FIG. 10.
FIG. 10.
Insulin secretion in ped/pea-15-overexpressing MIN6 cells. (a) MIN6 beta cells were stably transfected with ped/pea-15 cDNA. Several clones overexpressing ped/pea-15 by 3-, 5-, and 10-fold were selected. Three clones were further characterized (termed clones a, b, and c). (b) Transfected cell clones, untransfected cells (NT), and cells transfected with the empty plasmid (PC) were stimulated with either 0.1 mM glucose (open bars) or 16.7 mM glucose (dashed bars), and insulin was assayed in the culture medium as described in the text. Bars represent values ± standard deviation of triplicate measurements in five independent experiments. The differences between ped/pea-15-overexpressing (all clones) and control cells (whether untransfected or transfected with the empty plasmid) were significant at P < 0.01 (basal secretion) and P < 0.001 (glucose-induced secretion). (c) Alternatively, control cells transfected with the empty plasmid (PC) or clone c (Cl.c) cells were transfected either with ped/pea-15 antisense (AS) or with scrambled (SC) oligonucleotides. (d) Glucose-stimulated insulin secretion was assayed as outlined above. Bars represent values ± standard deviation of triplicate measurements in four independent experiments. Basal insulin secretion differences in the antisense versus scrambled oligonucleotide-treated cells were significant at P < 0.001 (empty plasmid-transfected cells) and P < 0.01 (clone c cells). Glucose-stimulated secretion differences in the antisense versus scrambled oligonucleotide-treated cells were also significant at the P < 0.001 (empty plasmid-transfected cells) and P < 0.01 levels (clone c cells).
FIG. 11.
FIG. 11.
PKCα activity, phospholipase D1 expression, and diacylglycerol levels in ped/pea-15-overexpressing MIN6 cells. MIN6 beta cells stably transfected with ped/pea-15 cDNA (clone c) or the empty vector (empty plasmid-transfected cells [PC]) and untransfected cells (NT) were assayed for PKCα activity (a), phospholipase D1 (PLD1) expression (b), and diacylglycerol (DAG) (c) levels as outlined in the legend to Fig. 6. Western-blotted phospholipase D1 bands were revealed by enhanced chemiluminescence and autoradiography and quantitated by laser densitometry. Bars represent the means ± standard deviation of four (PKCα and phospholipase D1), and five (diacylglycerol) independent determinations. Based on t test analysis, the differences between ped/pea-15-overexpressing and control cells were significant at the P < 0.001 level.

Similar articles

Cited by

References

    1. Arner, P. 2002. Insulin resistance in type 2 diabetes: role of fatty acids. Diabetes Metab. Res. Rev. 18(Suppl. 2):S5-S9. - PubMed
    1. Bell, G. I., and K. S. Polonsky. 2001. Diabetes mellitus and genetically programmed defects in beta-cell function. Nature 414:788-791. - PubMed
    1. Boden, G., and G. I. Shulman. 2002. Free fatty acids in obesity and type 2 diabetes: defining their role in the development of insulin resistance and beta-cell dysfunction. Eur. J. Clin. Investig. 32(Suppl. 3):14-23. - PubMed
    1. Caruso, M., C. Miele, A. Oliva, G. Condorelli, F. Oriente, G. Riccardi, B. Capaldo, F. Fiory, D. Accili, P. Formisano, and F. Beguinot. 2000. The IR1152 mutant insulin receptor selectively impairs insulin action in skeletal muscle but not in liver. Diabetes 49:1194-1202. - PubMed
    1. Condorelli, G., A. Trencia, G. Vigliotta, A. Perfetti, U. Goglia, A. Cassese, A. M. Musti, C. Miele, S. Santopietro, P. Formisano, and F. Beguinot. 2002. Multiple members of the mitogen-activated protein kinase family are necessary for PED/PEA-15 anti-apoptotic function. J. Biol. Chem. 277:11013-11018. - PubMed

Publication types