

NFAM1, an immunoreceptor tyrosine-based activation motif-bearing molecule that regulates B cell development and signaling
- PMID: 15143214
- PMCID: PMC419568
- DOI: 10.1073/pnas.0401119101
NFAM1, an immunoreceptor tyrosine-based activation motif-bearing molecule that regulates B cell development and signaling
Abstract
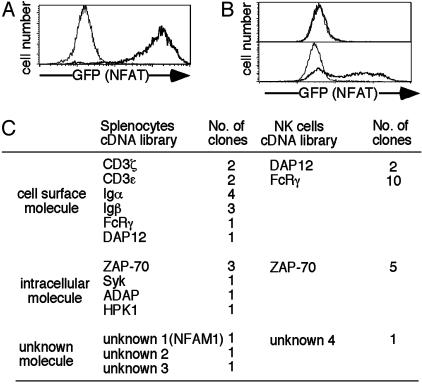
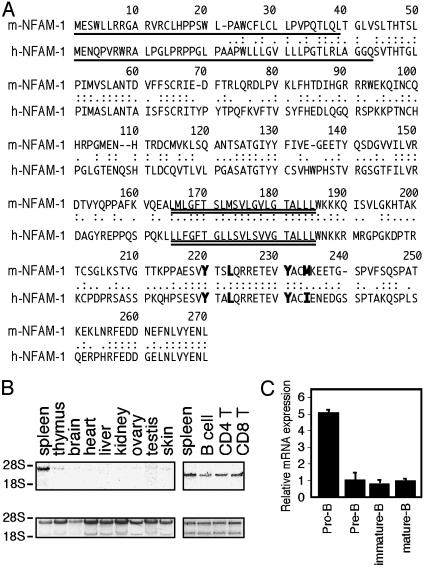
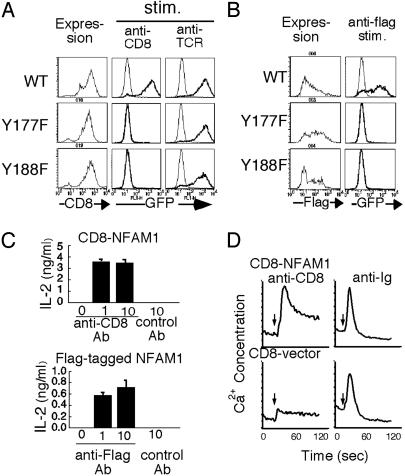
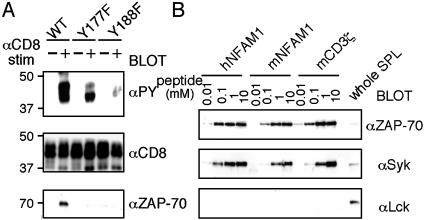
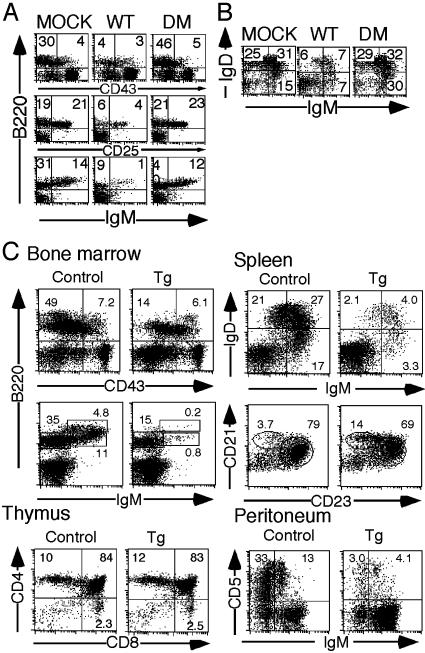
A functional cDNA cloning system was developed by using a retrovirus library encoding CD8-chimeric proteins and a nuclear factor of activated T cells (NFAT)-GFP reporter cell line to identify molecules inducing NFAT activation. By using this strategy, NFAT activating molecule 1 (NFAM1) was cloned as an immunoreceptor tyrosine-based activation motif (ITAM)-bearing cell surface molecule belonging to the Ig superfamily and is predominantly expressed in spleen B and T cells. NFAM1 crosslinking induced ITAM phosphorylation, ZAP-70/Syk recruitment, NFAT activation, and cytokine production. In vivo overexpression of NFAM1 in bone marrow chimeras and transgenic mice induced severe impairment of early B cell development in an ITAM-dependent manner. In NFAM1-expressing B cells, B cell antigen receptor stimulation induced NFAM1 translocation to lipid raft, and NFAM1 co-crosslinking augmented B cell antigen receptor signaling. The results suggest that NFAM1 modulates B cell signaling through its ITAM, which regulates B cell development.
Figures

Similar articles
-
NFAM1 Promotes Pro-Inflammatory Cytokine Production in Mouse and Human Monocytes.Front Immunol. 2022 Jan 13;12:773445. doi: 10.3389/fimmu.2021.773445. eCollection 2021. Front Immunol. 2022. PMID: 35095847 Free PMC article.
-
Inhibition of NFAM1 suppresses phospho-SAPK/JNK signaling during osteoclast differentiation and bone resorption.J Cell Biochem. 2021 Oct;122(10):1534-1543. doi: 10.1002/jcb.30076. Epub 2021 Jul 6. J Cell Biochem. 2021. PMID: 34228377 Free PMC article.
-
NFAM1 signaling enhances osteoclast formation and bone resorption activity in Paget's disease of bone.Bone. 2017 Aug;101:236-244. doi: 10.1016/j.bone.2017.05.013. Epub 2017 May 12. Bone. 2017. PMID: 28506889 Free PMC article.
-
Inhibition of immune responses by ITAM-bearing receptors.Sci STKE. 2006 Jan 31;2006(320):re1. doi: 10.1126/stke.3202006re1. Sci STKE. 2006. PMID: 16449667 Review.
-
Tonic B-cell and viral ITAM signaling: context is everything.Immunol Rev. 2007 Aug;218:214-34. doi: 10.1111/j.1600-065X.2007.00535.x. Immunol Rev. 2007. PMID: 17624955 Review.
Cited by
-
Aminophospholipids are signal-transducing TREM2 ligands on apoptotic cells.Sci Rep. 2019 May 17;9(1):7508. doi: 10.1038/s41598-019-43535-6. Sci Rep. 2019. PMID: 31101881 Free PMC article.
-
Mutated Leguminous Lectin Containing a Heparin-Binding like Motif in a Carbohydrate-Binding Loop Specifically Binds to Heparin.PLoS One. 2015 Dec 29;10(12):e0145834. doi: 10.1371/journal.pone.0145834. eCollection 2015. PLoS One. 2015. PMID: 26714191 Free PMC article.
-
Tumor necrosis factor-related genes and colon and rectal cancer.Int J Mol Epidemiol Genet. 2011;2(4):328-38. Epub 2011 Oct 20. Int J Mol Epidemiol Genet. 2011. PMID: 22199996 Free PMC article.
-
Heat-Killed Levilactobacillus brevis as a Candidate Postbiotics Through Immunostimulation Mediated by Macrophage-Inducible C-Type Lectin.Probiotics Antimicrob Proteins. 2023 Jun;15(3):774-784. doi: 10.1007/s12602-021-09890-5. Epub 2022 Jan 20. Probiotics Antimicrob Proteins. 2023. PMID: 35048327
-
PD-L1 siRNA-mediated silencing in acute myeloid leukemia enhances anti-leukemic T cell reactivity.Bone Marrow Transplant. 2020 Dec;55(12):2308-2318. doi: 10.1038/s41409-020-0966-6. Epub 2020 Jun 11. Bone Marrow Transplant. 2020. PMID: 32528120
References
MeSH terms
Substances
LinkOut - more resources
Full Text Sources
Other Literature Sources
Molecular Biology Databases
Research Materials
Miscellaneous
