. 2004 Jul 1;558(Pt 1):283-94.
doi: 10.1113/jphysiol.2004.066654. Epub 2004 May 14.

Thermoeffector neuronal pathways in fever: a study in rats showing a new role of the locus coeruleus

Affiliations

Thermoeffector neuronal pathways in fever: a study in rats showing a new role of the locus coeruleus

Maria C Almeida et al. J Physiol. .

Abstract

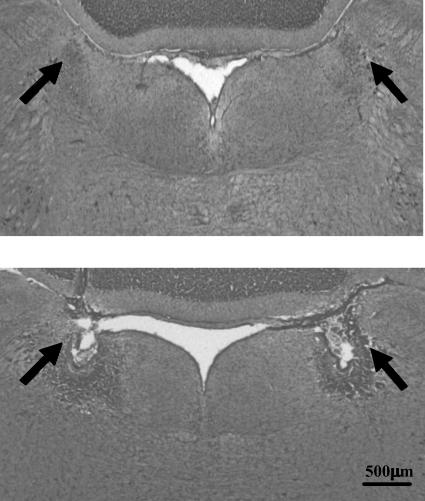
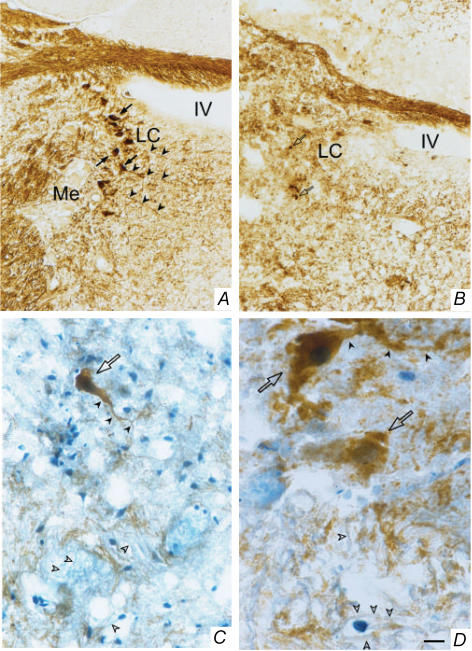
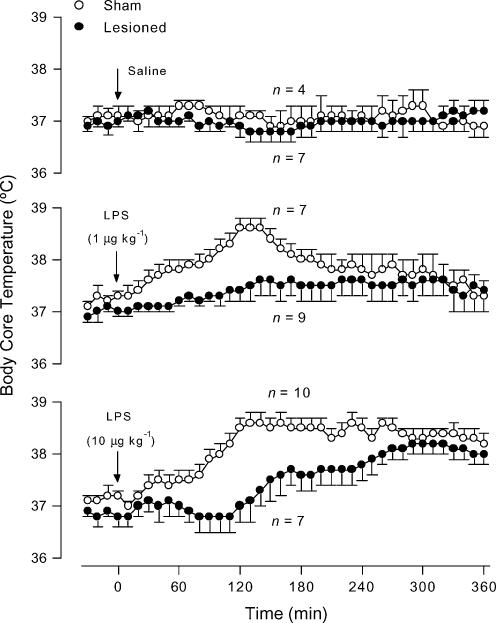
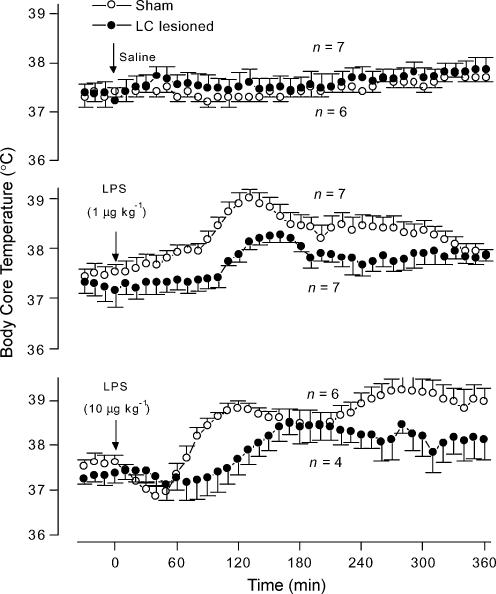
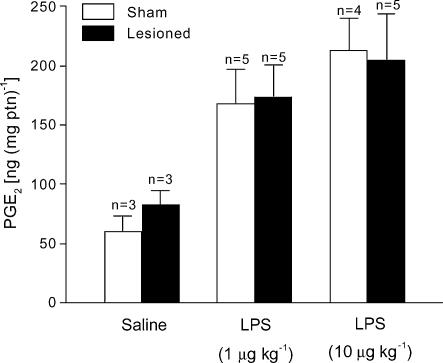
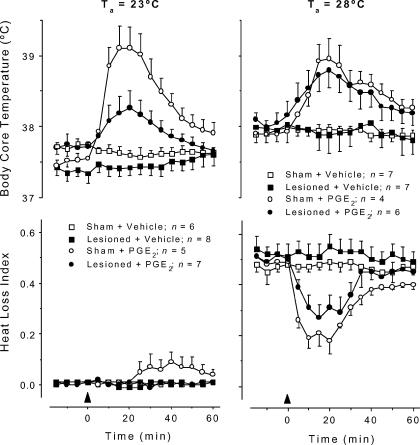
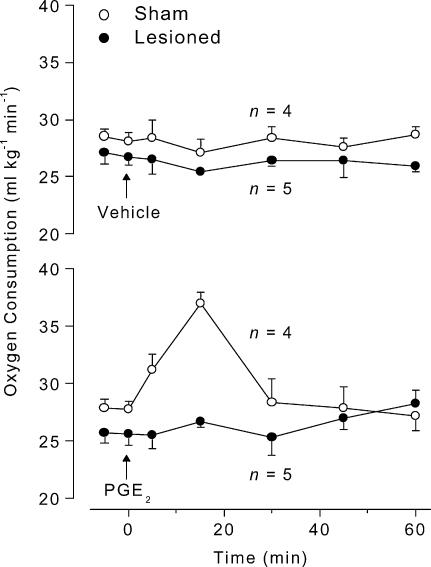
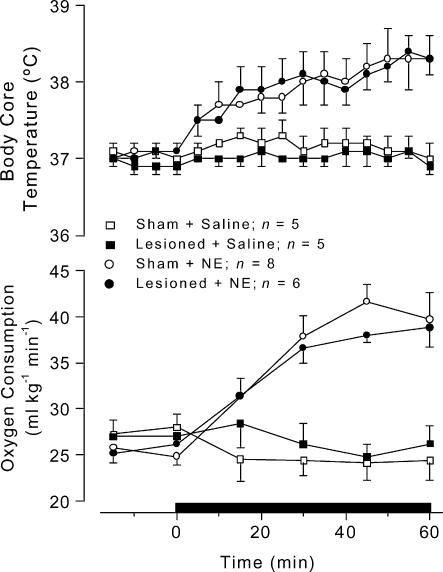
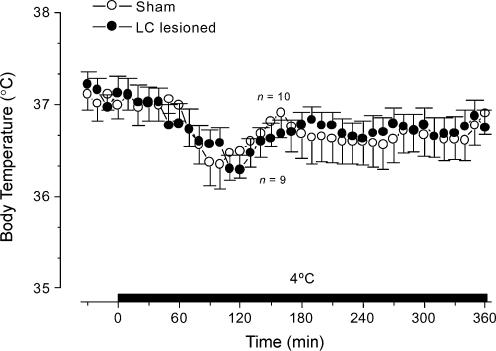
It is known that brain noradrenaline (norepinephrine) mediates fever, but the neuronal group involved is unknown. We studied the role of the major noradrenergic nucleus, the locus coeruleus (LC), in lipopolysaccharide (LPS)-induced fever. Male Wistar rats had their LC completely ablated electrolytically or their catecholaminergic LC neurones selectively lesioned by microinjection of 6-hydroxydopamine; the controls were sham-operated. Both lesions resulted in a marked attenuation of LPS (1 or 10 microg kg(-1), i.v.) fever at a subneutral (23 degrees C) ambient temperature (Ta). Because electrolytic and chemical lesions produced similar effects, the role of the LC in fever was further investigated using electrolytic lesions only. The levels of prostaglandin (PG) E2, the terminal mediator of fever, were equally raised in the anteroventral third ventricular region of LC-lesioned and sham-operated rats during the course of LPS fever, indicating that LC neurones are not involved in febrigenic signalling to the brain. To investigate the potential involvement of the LC in an efferent thermoregulatory neuronal pathway, the thermoregulatory response to PGE(2) (25 ng, i.c.v.) was studied at a subneutral (23 degrees C, when fever is brought about by thermogenesis) or neutral (28 degrees C, when fever is brought about by tail skin vasoconstriction) Ta. The PGE2-induced increases in metabolic rate (an index of thermogenesis) and fever were attenuated in LC-lesioned rats at 23 degrees C, whereas PGE2-induced skin vasoconstriction and fever normally developed in LC-lesioned rats at 28 degrees C. The LC-lesioned rats had attenuated PGE2 thermogenesis despite the fact that they were fully capable of activating thermogenesis in response to noradrenaline and cold exposure. It is concluded that LC neurones are part of a neuronal network that is specifically activated by PGE2 to increase thermogenesis and produce fever.


Figures

Figure 1
Figure 1. Representative photomicrograph of an electrolytic lesion of the locus coeruleus (LC)
The figure shows coronal sections at the pons level illustrating the location of the LC (upper panel) and a typical LC lesion (lower panel). The arrows indicate either the intact LC or the site of lesion.
Figure 2
Figure 2. Representative photomicrographs of a chemical (6-hydroxydopamine) lesion of the LC
The catecholaminergic cell bodies were identified by tyrosine hydroxylase immunohistochemical staining (dark brown) of the brains of sham-operated (A) or LC-lesioned rats (BD). The number of neurones (black arrows) and fibres (black arrowheads) positive to tyrosine hydroxylase were dramatically reduced in LC-lesioned rats (B). Note also the presence of a few catecholaminergic neurones with pycnotic, presumably non-functional, perikarya (open arrows) in LC-lesioned rats (B); a detailed (higher magnification) morphology of these neurones is shown in C and D. Tyrosine hydroxylase-negative fibres (blue staining; open arrowheads), i.e. fibres of passage, were found in abundance in the epicentre of the lesion (C and D). LC, locus coeruleus; Me, mesencephalic trigeminal nucleus; IV, fourth ventricle. Scale bars: 48 μm in A and B, 24 μm in C, and 9.6 μm in D.
Figure 3
Figure 3. LPS-induced fever in LC-lesioned and sham-operated rats
The figure shows body core temperature responses to saline (upper panel) and intravenous LPS doses of 1 μg kg−1 (middle panel) and 10 μg kg−1 (bottom panel) of LC-lesioned and sham-operated rats. The experiment was conducted at an ambient temperature of 23°C. The arrows indicate the times of injection. n, number of animals per group.
Figure 4
Figure 4. LPS-induced fever in chemically LC-lesioned and sham-operated rats
The figure shows body core temperature responses to saline (upper panel) and intravenous LPS doses of 1 μg kg−1 (middle panel) and 10 μg kg−1 (bottom panel) of chemically LC-lesioned and sham-operated rats. The experiment was conducted at an ambient temperature of 23°C. The arrows indicate the times of injection. n, number of animals per group.
Figure 5
Figure 5. Changes in PGE2 levels induced by LPS in LC-lesioned and sham-operated rats
The levels of PGE2 were measured in the anteroventral third ventricular (AV3V) region of LC-lesioned and sham-operated rats 120 min after challenge with intravenous LPS (1 or 10 μg kg−1) or saline. The experiment was conducted at 23°C. n, number of animals per group.
Figure 6
Figure 6. PGE2-induced fever in LC-lesioned and sham-operated rats
The figure shows body core temperature and heat loss index responses to PGE2 (25 ng, i.c.v.) or its vehicle (20% ethanol in saline) of LC-lesioned and sham-operated rats. The experiment was conducted at an ambient temperature (Ta) of either 23°C (left panels) or 28°C (right panels). The arrowheads indicate the times of injection. n, number of animals per group.
Figure 7
Figure 7. PGE2-induced changes in oxygen consumption in LC-lesioned and sham-operated rats
The figure shows oxygen consumption responses to PGE2 (25 ng, i.c.v.) or its vehicle (20% ethanol in saline) of LC-lesioned and sham-operated rats. The experiment was conducted at an ambient temperature (Ta) of 23°C. The arrows indicate the times of injection. n, number of animals per group.
Figure 8
Figure 8. Intravenous noradrenaline-induced changes in body core temperature and oxygen consumption of LC-lesioned and sham-operated rats
Noradrenaline was intravenously infused at a total dose of 240 μg kg−1 over 60 min. Control rats received intravenous saline at the same rate. The horizontal bar indicates the time of infusion. n, number of animals per group.
Figure 9
Figure 9. Changes in body core temperature of LC-lesioned and sham-operated rats exposed to a 4°C environment
The figure shows Tc responses to cold exposure (4°C) of LC-lesioned and sham-operated rats. The horizontal bar indicates the time of cold exposure. n, number of animals per group.

References

    1. Aston-Jones G, Shipley MT, Chouvet G, Ennis M, van Bockstaele E, Pieribone V, Shiekhattar R, Akaoka H, Drolet G, Astier B, Charléty P, Valentino RJ, Williams JT. Afferent regulation of locus coeruleus neurons: anatomy, physiology and pharmacology. Prog Brain Res. 1991;88:47–75. - PubMed
    1. Aston-Jones G, Shipley MT, Grzanna R. The locus coeruleus, A5 and A7 noradrenergic cell groups. In: Paxinos G, editor. The Rat Nervous System. Sydney: Academic Press, Inc.; 1995. pp. 183–213.
    1. Bachtell RK, Tsivkovskaia NO, Ryabinin E. Identification of temperature-sensitive neural circuits in mice using c-fos expression mapping. Brain Res. 2003;960:157–164. - PubMed
    1. Berridge CW, Waterhouse BD. The locus coeruleus—noradrenergic system: modulation of behavioral state and state-dependent cognitive processess. Brain Res Rev. 2003;42:33–84. - PubMed
    1. Blatteis CM, Sehic E. Fever: how may circulating pyrogens signal the brain? News Physiol Sci. 1997a;12:1–9.

Publication types