

Differences in activity-dependent hyperpolarization in human sensory and motor axons
- PMID: 15146048
- PMCID: PMC1664913
- DOI: 10.1113/jphysiol.2004.063966
Differences in activity-dependent hyperpolarization in human sensory and motor axons
Abstract
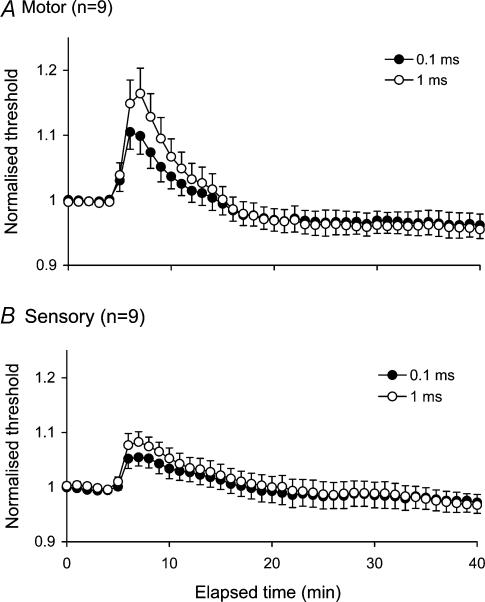
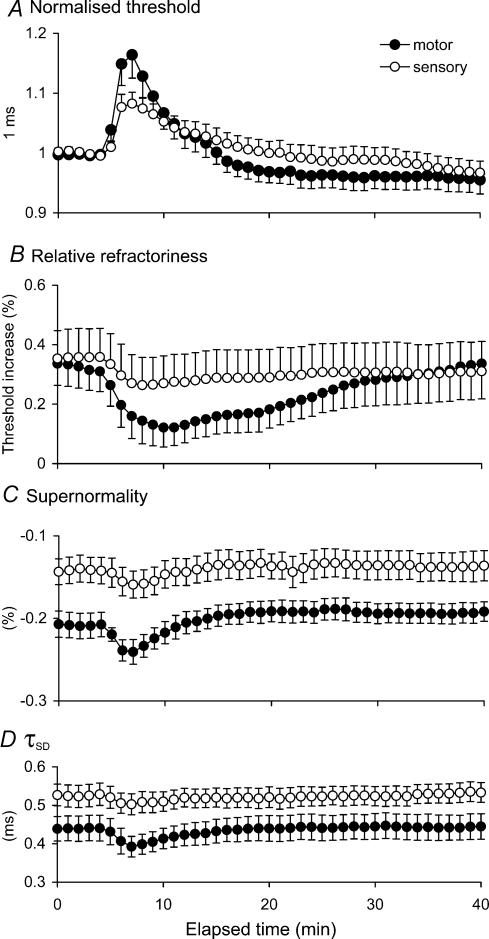
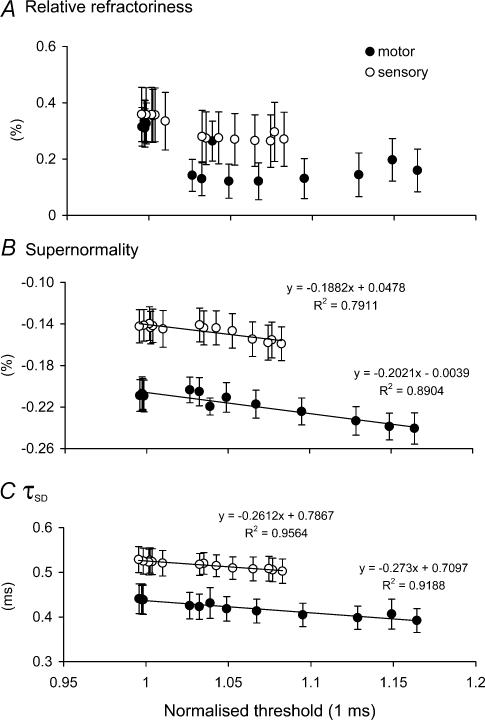
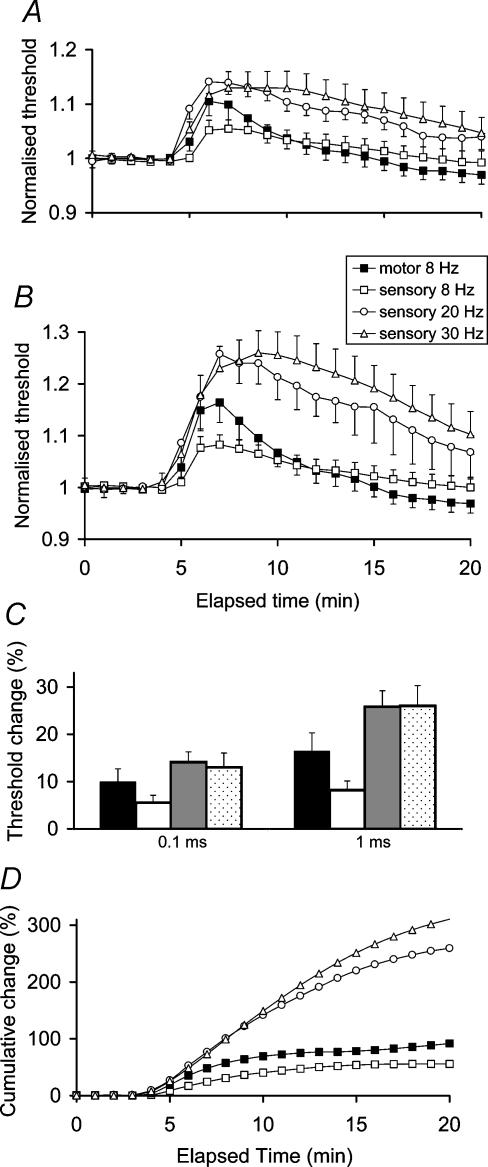
The present study was undertaken to determine whether activity-dependent changes in axonal excitability are greater in motor axons than cutaneous afferents for the same impulse load. In nine healthy subjects, supramaximal stimulation at 8 Hz was delivered to the median nerve at the wrist. Changes in the threshold current required to generate compound motor and sensory potentials approximately 50% of maximum and other indices of axonal excitability were tracked before and after repetitive stimulation for 10 min. The long-lasting stimulation produced a prolonged depression in the excitability of both cutaneous afferents and motor axons, with gradual recovery to control levels over 15-20 min. These changes in threshold were associated with a reduction in refractoriness, an increase in supernormality and a decrease in the strength-duration time constant, changes consistent with axonal hyperpolarization. Greater changes in threshold occurred in motor axons: threshold increased by 9.9% and 16.4% for test stimulus durations of 0.1 and 1 ms, respectively, for motor axons and by 5.4% and 8.3% for cutaneous afferents. With higher stimulus frequencies and thereby greater impulse loads, greater threshold changes could be induced in cutaneous afferents. It is argued that the hyperpolarization resulted from activity of the electrogenic Na(+)-K+ pump, that it requires > 125 ms to restore the resting state following an action potential, and that significant intracellular Na+ accumulation occurs during a steady 8-Hz train. These findings imply that physiological discharge rates will activate the pump and thereby produce axonal hyperpolarization, the extent of which will vary with impulse load. A plausible explanation is that greater activity-dependent hyperpolarization in motor axons is due to less inward rectification as a result of less activity of the hyperpolarization-activated cation conductance (IH) than in cutaneous afferents.
Figures
References
-
- Applegate C, Burke D. Changes in excitability of human cutaneous afferents following prolonged high-frequency stimulation. Brain. 1989;112:147–164. - PubMed
-
- Bergmans J. The Physiology of Single Human Nerve Fibres. Louvain Belgium: Vander; 1970.
-
- Bergmans J. Repetitive activity induced in single human motor axons: a model for pathological repetitive activity. In: Culp WJ, Ochoa J, editors. Abnormal Nerves and Muscles as Impulse Generators. Oxford: Oxford University Press; 1982. pp. 393–418.
-
- Bostock H, Bergmans J. Post-tetanic excitability changes and ectopic discharges in a human motor axon. Brain. 1994;117:913–928. - PubMed
-
- Bostock H, Burke D, Hales JP. Differences in behaviour of sensory and motor axons following release of ischaemia. Brain. 1994;117:225–234. - PubMed
Publication types
MeSH terms
LinkOut - more resources
Full Text Sources
Medical