

Tethered ligand-derived peptides of proteinase-activated receptor 3 (PAR3) activate PAR1 and PAR2 in Jurkat T cells
- PMID: 15147561
- PMCID: PMC1782474
- DOI: 10.1111/j.1365-2567.2004.01870.x
Tethered ligand-derived peptides of proteinase-activated receptor 3 (PAR3) activate PAR1 and PAR2 in Jurkat T cells
Abstract
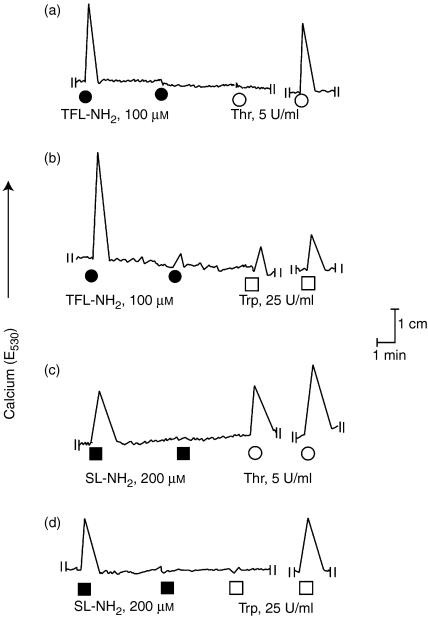
Proteinase-activated receptors (PARs) can activate a number of signalling events, including T-cell signal-transduction pathways. Recent data suggest that the activation of PARs 1, 2 and 3 in Jurkat T-leukaemic cells induces tyrosine phosphorylation of the haematopoietic signal transducer protein, VAV1. To activate the PARs, this study used the agonist peptides SFLLRNPNDK, SLIGKVDGTS and TFRGAPPNSF, which are based on the sequences of the tethered ligand sequences of human PARs 1, 2 and 3, respectively. Here, we show that peptides based on either the human or murine PAR(3)-derived tethered ligand sequences (TFRGAP-NH(2) or SFNGGP-NH(2)) do not activate PAR(3), but rather activate PARs 1 and 2, either in Jurkat or in other PAR-expressing cells. Furthermore, whilst thrombin activates only Jurkat PAR(1), trypsin activates both PARs 1 and 2 and also disarms Jurkat PAR(1) for thrombin activation. We conclude therefore that in Jurkat or related T cells, signalling via PARs that can affect VAV1 phosphorylation is mediated via PAR 1 or 2, or both, and that distinct serine proteinases may potentially differentially affect T-cell function in the settings of inflammation.
Figures


Similar articles
-
Proteinase-activated receptors (PARs)--the PAR3 Neo-N-terminal peptide TFRGAP interacts with PAR1.Regul Pept. 2005 Feb 15;125(1-3):61-6. doi: 10.1016/j.regpep.2004.07.032. Regul Pept. 2005. PMID: 15582715
-
Kallikrein-mediated cell signalling: targeting proteinase-activated receptors (PARs).Biol Chem. 2006 Jun;387(6):817-24. doi: 10.1515/BC.2006.104. Biol Chem. 2006. PMID: 16800746
-
Proteinase-mediated cell signalling: targeting proteinase-activated receptors (PARs) by kallikreins and more.Biol Chem. 2006 Jun;387(6):677-85. doi: 10.1515/BC.2006.086. Biol Chem. 2006. PMID: 16800728 Review.
-
Protease-activated receptor mediated RhoA signaling and cytoskeletal reorganization in LNCaP cells.Biochemistry. 2003 Jan 28;42(3):702-9. doi: 10.1021/bi027100x. Biochemistry. 2003. PMID: 12534282
-
Kallikreins and proteinase-mediated signaling: proteinase-activated receptors (PARs) and the pathophysiology of inflammatory diseases and cancer.Biol Chem. 2008 Jun;389(6):643-51. doi: 10.1515/BC.2008.077. Biol Chem. 2008. PMID: 18627296 Review.
Cited by
-
Proteinases and signalling: pathophysiological and therapeutic implications via PARs and more.Br J Pharmacol. 2008 Mar;153 Suppl 1(Suppl 1):S263-82. doi: 10.1038/sj.bjp.0707507. Epub 2007 Dec 3. Br J Pharmacol. 2008. PMID: 18059329 Free PMC article. Review.
-
Modulation of protease-activated receptor expression by Porphyromonas gingivalis in human gingival epithelial cells.BMC Oral Health. 2015 Oct 17;15(1):128. doi: 10.1186/s12903-015-0105-8. BMC Oral Health. 2015. PMID: 26476532 Free PMC article.
-
Targeting melanoma growth and metastasis with systemic delivery of liposome-incorporated protease-activated receptor-1 small interfering RNA.Cancer Res. 2008 Nov 1;68(21):9078-86. doi: 10.1158/0008-5472.CAN-08-2397. Cancer Res. 2008. PMID: 18974154 Free PMC article.
-
Optical biosensor differentiates signaling of endogenous PAR1 and PAR2 in A431 cells.BMC Cell Biol. 2007 Jun 22;8:24. doi: 10.1186/1471-2121-8-24. BMC Cell Biol. 2007. PMID: 17587449 Free PMC article.
-
N-linked glycosylation regulates human proteinase-activated receptor-1 cell surface expression and disarming via neutrophil proteinases and thermolysin.J Biol Chem. 2011 Jul 1;286(26):22991-3002. doi: 10.1074/jbc.M110.204271. Epub 2011 May 6. J Biol Chem. 2011. PMID: 21550978 Free PMC article.
References
-
- Hollenberg MD, Compton SJ. International Union of Pharmacology. XXVIII. Proteinase-activated receptors. Pharmacol Rev. 2002;54:203–17. - PubMed
-
- Déry O, Corvera CU, Steinhoff M, Bunnett NW. Proteinase-activated receptors: novel mechanisms of signaling by serine proteases. Am J Physiol. 1998;274:C1429–52. - PubMed
-
- Coughlin SR. Thrombin signalling and protease-activated receptors. Nature. 2000;407:258–64. - PubMed
-
- Blackhart BD, Emilsson K, Nguyen D, Teng W, Martelli AJ, Nystedt S, Sundelin J, Scarborough RM. Ligand cross-reactivity within the protease-activated receptor family. J Biol Chem. 1996;271:16466–71. - PubMed
-
- Hollenberg MD, Saifeddine M, Al-Ani B, Kawabata A. Proteinase-activated receptors: structural requirements for activity, receptor cross-reactivity, and receptor selectivity of receptor-activating peptides. Can J Physiol Pharmacol. 1997;75:832–41. - PubMed
Publication types
MeSH terms
Substances
LinkOut - more resources
Full Text Sources
Other Literature Sources
Miscellaneous