. 2004 Jun;112(2):274-89.
doi: 10.1111/j.1365-2567.2004.01862.x.

Aberration of CCR7 CD8 memory T cells from patients with systemic lupus erythematosus: an inducer of T helper type 2 bias of CD4 T cells

Affiliations

Aberration of CCR7 CD8 memory T cells from patients with systemic lupus erythematosus: an inducer of T helper type 2 bias of CD4 T cells

Yang Sen et al. Immunology. 2004 Jun.

Abstract

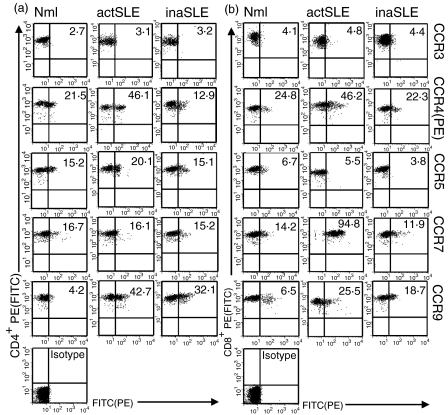
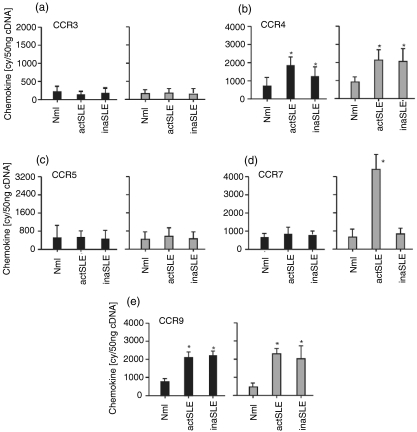
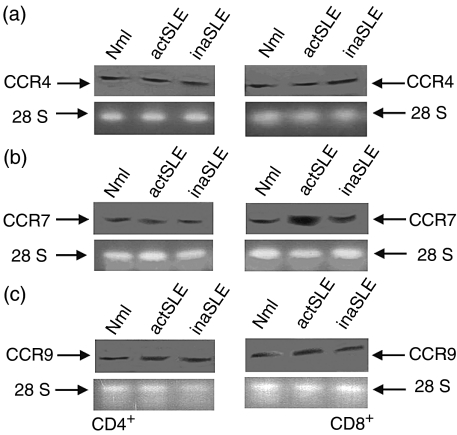
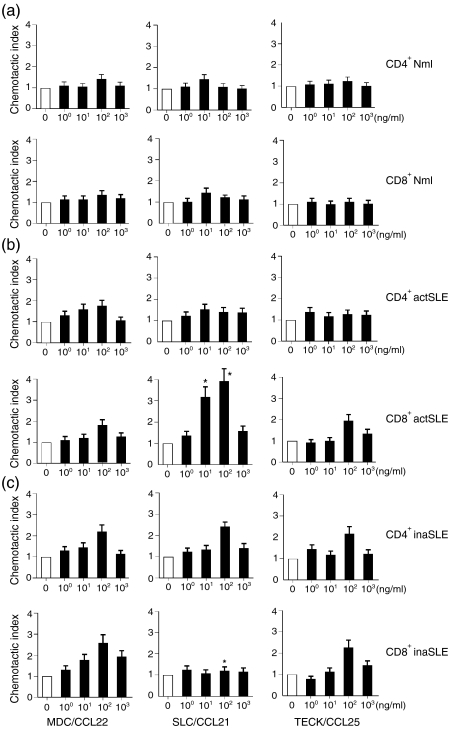
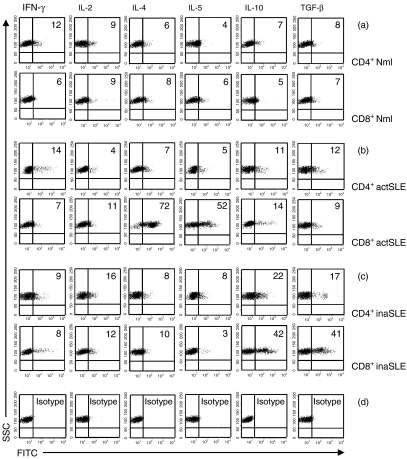
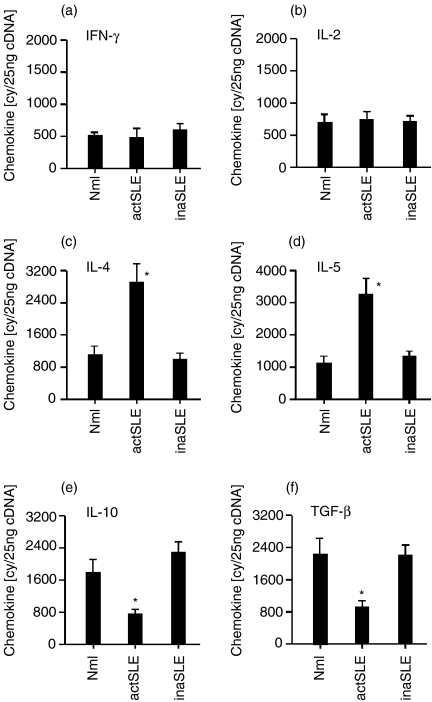
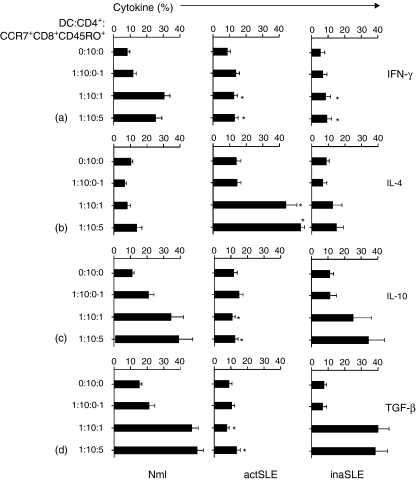
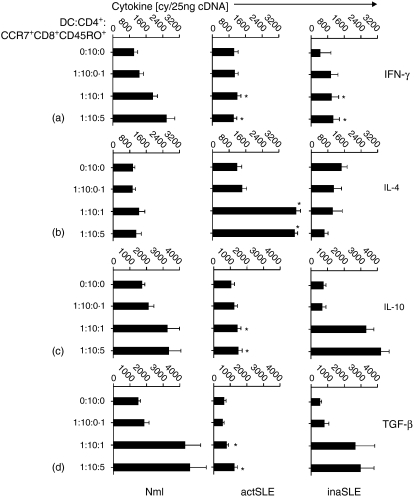
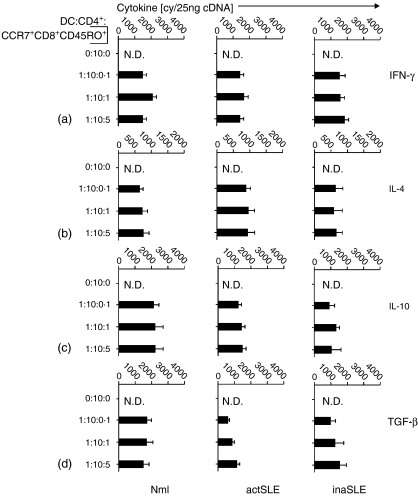
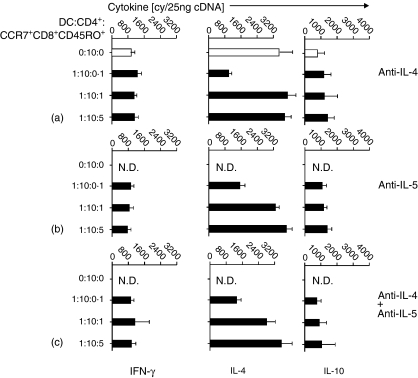
Chemokine receptors are important in the entry of leucocytes into the inflammatory sites of systemic lupus erythematosus (SLE). CCR7(+) and CCR7(-) memory T cells exert different functions in homing, cytokine production and cytotoxicity. To determine whether differential expression and functions of the CCR7 occur in SLE patients, we examined CCR3, CCR4, CCR5, CCR7 and CCR9 on CD4(+) and CD8(+) T cells from normal and SLE subjects. Flow cytometry, real-time quantitative reverse transcription polymerase chain reactions and Northern blotting were used to detect the expression of chemokine receptors and cytokines; a chemotaxis assay was used to detect their functions. CD4(+) T-cell stimulation with syngeneic CCR7(+) CD8(+) CD45RO(+) T cells and dendritic cells (including transwell chambers) was used to induce cytokine expression. We demonstrated that CCR7 was selectively, frequently and functionally expressed on CD8(+) (94.8%) but not on CD4(+) (16.1%) T cells from patients with active SLE, whereas this phenomenon was not seen in normal subjects and in those whose SLE was inactive. CCR7(+) CD8(+) CD45RO(+) memory T cells from patients with active SLE, themselves T helper type 2 (Th2) biased, were inducers of Th2 bias in CD4(+) T cells in a cell-cell contact manner in vitro, meanwhile, the cells from both normal subjects and those whose SLE was inactive drove CD4(+) T cells into a regulatory T-cell-derived cytokine pattern. Our findings might provide new clues to understanding the functions of CCR7(+) CD8(+) CD45RO(+)'central' memory T cells in autoimmune diseases (such as SLE). We suggest that in the case of active SLE, CCR7(+) central memory T cells were able to enter peripheral blood and inflammatory sites from secondary lymphoid organs, were continuously expressing CCR7, and interacted with dendritic cells and functioned as CCR7(-)'effector' memory T cells, which were described in normal humans.


Figures

Figure 1
Figure 1
Chemokine receptor distribution. Double-colour flow cytometric analysis of the distribution of chemokine receptors as indicated on CD4+ (a) or CD8+ (b) T cells from normal subjects (Nml), patients with active SLE (actSLE) and those with inactive SLE (inaSLE). The CD4+ and CD8+ T cells were freshly isolated and stained as described in the Materials and methods. The graphs in bottom lefthand corner in the panels are isotype controls. The numbers in the graphs are percentages of chemokine receptor-positive cells as indicated. The data are from a single experiment, which was representative of at least six similar experiments performed. The demarcations for analysis of chemokine receptor-positive cells were defined within 1·5–2% of negative controls according to the manufacturer's recommendation. To simplify, only isotype antibody controls for CCR7 staining on CD4+ and CD8antibody controls for CCR7 staining on CD4+ T cells from patient with active SLE were shown, but all chemokine receptor-positive cells were gated according to simultaneous isotype antibody control staining. (a), CCR4(b), CCR5(c), CCR7(d) and CCR9(e) in freshly isolated CD4antibody controls for CCR7 staining on CD4+ (black bars) and CD8antibody controls for CCR7 staining on CD4++ (grey bars) T cells from normal subjects (Mnl) and patients with active SLE (actSLE) or inactive SLE (inaSLE). The procedure for quantitative RT-PCR amplification was described in the Materials and methods. Statistically significant differences as compared with normal controls are indicated (*P<0·01). The illustrated data were mean values (± SD) of six experiments.
Figure 2
Figure 2
Chemokine receptor mRNA. The real-time quantitative detection of RT-PCR for mRNA of CCR3 (a), CCR4 (b), CCR5 (c), CCR7 (d) and CCR9 (e) in freshly isolated CD4+ (black bars) and CD8+ (grey bars) T cells from normal subjects (Mnl) and patients with active SLE (actSLE) or inactive SLE (inaSLE). The procedure for quantitative RT-PCR amplification was described in the Materials and methods. Statistically significant differences as compared with normal controls are indicated (*P < 0·01). The illustrated data were mean values (± SD) of six experiments.
Figure 3
Figure 3
Chemokine receptor mRNA. Northern blot of CCR4 (a), CCR7 (b) and CCR9 (c) mRNA in freshly isolated CD4+ (left panels) CD8+ (right panels) T cells from normal subjects (Mnl) and patients with active SLE (actSLE) or inactive SLE (inaSLE). Total RNA from different cells as indicated were isolated, electrophoresed and blotted as described in the Materials and methods. The hybridization signals for CCR4, CCR7, or CCR9 mRNA in CD4+ or CD8+ T cells from different subjects are shown in the upper panels. The 28S rRNAs in the lower panels confirm that comparable amounts of total RNA were loaded. The illustrated data are from a single representative experiment of six performed.
Figure 4
Figure 4
Chemotaxis analysis. The migration of freshly isolated CD4+ or CD8+ T cells from normal subjects (Nml) and patients with active SLE (actSLE) or inactive SLE (inaSLE) towards MDC/CCL22, SLC/CCL21 and TECK/CCL25. All results were determined as described in the Materials and methods and expressed as a Chemotactic Index (CI ± SD), based on triplicate determinations of chemotaxis on each concentration of chemokine applied. The applied chemokine concentrations are indicated as ng/ml. The open bars indicate spontaneous migration towards negative (medium) control (known as MCNC; CI = 1) in each experiment. Statistically significant differences as compared with normal controls are indicated (*P < 0·01). The illustrated data are from a single representative experiment of eight performed.
Figure 5
Figure 5
Intracellular cytokine analysis. Intracellular Th1- (IFN-γ and IL-2), Th2- (IL-4 and IL-5) and Tr-derived (IL-10 and TGF-β) cytokine detection by flow cytometry as indicated. The purified cells were CCR7+ CD4+ CD45RO+ or CCR7+ CD8+ CD45RO+ T cells obtained by FACS sorting assay from normal subjects (Mnl)(a) and patients with active SLE (actSLE) (b) or inactive SLE (inaSLE)(c) as described in the Materials and methods. The graphs in (d) are isotype controls. The numbers listed in the figure are in percentage detected with intracellular cytokine assay as described in the Materials and methods. The illustrated data are from a single representative experiment of five performed.
Figure 6
Figure 6
Cytokine mRNA. The real-time quantitative detection of RT-PCR for mRNA of Th1- [IFN-γ, (a); IL-2, (b)], Th2- [IL-4, (c); IL-5, (d)] and Tr-derived [IL-10, (e); TGF-β, (f)] cytokines in freshly isolated CCR7+ CD8+ CD45RO+ T cells from normal subjects (Nml) and patients with active SLE (actSLE) or inactive SLE (inaSLE) obtained by FACS sorting assay as described in the Materials and methods. The procedure for quantitative RT-PCR amplification was also described in the Materials and methods. The data are representative of six similar experiments conducted. Statistically significant differences as compared with normal controls are indicated (*P<0·01).
Figure 7
Figure 7
Intracellular cytokine analysis. Intracellular Th1- (IFN-γ) (a), Th2- (IL-4) (b) and Tr-derived (IL-10 and TGF-β) (c, d) cytokine detection by flow cytometry as indicated. The CD4+ T cells were purified from normal subjects (Nml) and patients with active SLE (actSLE) or inactive SLE (inaSLE). The CD4+ T cells were then cocultured with optimal numbers of mature syngeneic DCs and with the indicated numbers of purified syngeneic CCR7+ CD8+ CD45RO+ memory T cells in the presence of tetanus toxoid as described in the Materials and methods. CD4+ T cells were then harvested using Dynabeads as described in the Materials and methods. The numbers listed in the figure are in percentage detected with intracellular cytokine assay as described in Materials and methods. The illustrated data are from a single representative experiment of five performed. Statistically significant differences as compared with normal controls are indicated (*P<0·01).
Figure 8
Figure 8
Cytokine mRNA. The real-time quantitative detection of RT-PCR for mRNA of Th1- (IFN-γ) (a), Th2- (IL-4) (b) and Tr-derived (IL-10 and TGF-β) (c, d) cytokines in stimulated CD4+ T cells from normal subjects (Nml) and patients with active SLE (actSLE) or inactive SLE (inaSLE). The purified CD4+ T cells were then cocultured with optimal numbers of mature syngeneic DCs and with the indicated numbers of purified syngeneic CCR7+ CD8+ CD45RO+ memory T cells in the presence of tetanus toxoid, CD4+ T cells were then harvested using Dynabeads as described in the Materials and methods. The procedure for quantitative RT-PCR amplification was described in the Materials and methods. The data are representative of six similar experiments conducted. Statistically significant differences as compared with normal controls are indicated (*P<0·01).
Figure 9
Figure 9
Cytokine mRNA. The real-time quantitative detection of RT-PCR for mRNA of Th1- (IFN-γ) (a), Th2- (IL-4) (b) and Tr-derived (IL-10 and TGF-β) (c, d) cytokines in stimulated CD4+ T cells from normal subjects (Mnl) and patients with active SLE (actSLE) or inactive SLE (inaSLE). The purified cells were CD4+ T cells were then cocultured with optimal numbers of mature syngeneic DCs and with the indicated numbers of purified syngeneic CCR7+ CD8+ CD45RO+ memory T cells in a transwell manner (⊃) in the presence of tetanus toxoid, following the procedure of CD4+ cell purification as described in the Materials and methods. The procedure for quantitative RT-PCR amplification was described in the Materials and methods. The data are representative of six similar experiments conducted. N.D., not determined.
Figure 10
Figure 10
Cytokine mRNA. The real-time quantitative detection of RT-PCR for mRNA of Th1- (IFN-γ), Th2- (IL-4) and Tr-derived (IL-10) cytokines in stimulated CD4+ T cells from patients with active SLE. The purified cells, CD4+ T cells, were then cocultured with optimal numbers of mature syngeneic DCs in the presence of tetanus toxoid and with indicated different numbers of purified syngeneic CCR7+ CD8+ CD45RO+ memory T cells in the presence of anti-IL-4 (a), anti-IL-5 (b), or anti-IL-4 + anti-IL-5 (c) mAb(s), followed a procedure of CD4+ cell purification as described in the Materials and methods. Open bars indicate coculture without mAb. The procedure for quantitative RT-PCR amplification was described in the Materials and methods. The data are representative of five similar experiments conducted. N.D., not determined.

Similar articles

Cited by

References

    1. Rollins BJ. Chemokines. Blood. 1997;90:909–28. - PubMed
    1. Kotzin BL. Systemic lupus erythematosus. Cell. 1996;85:303–6. - PubMed
    1. Ishikawa S, Sato T, Abe M, et al. Aberrant high expression of B lymphocyte chemokine (BLC/CXCL13) by C11b+CD11c+ dendritic cells in murine lupus and preferential chemotaxis of B1 cells towards BLC. J Exp Med. 2001;193:1393–402. - PMC - PubMed
    1. Yamada M, Yagita H, Inoue H, et al. Selective accumulation of CCR4+ T lymphocytes into renal tissue of patients with lupus nephritis. Arthritis Rheum. 2002;46:735–40. - PubMed
    1. Furuichi K, Wada T, Sakai N, et al. Distinct expression of CCR1 and CCR5 in glomerular and interstitial lesions of human glomerular diseases. Am J Nephrol. 2000;20:291–9. - PubMed

Publication types

MeSH terms