

Micro-geographical variation in exposure to Schistosoma mansoni and malaria, and exacerbation of splenomegaly in Kenyan school-aged children
- PMID: 15147584
- PMCID: PMC421731
- DOI: 10.1186/1471-2334-4-13
Micro-geographical variation in exposure to Schistosoma mansoni and malaria, and exacerbation of splenomegaly in Kenyan school-aged children
Abstract
Background: Schistosoma mansoni and Plasmodium falciparum are common infections of school aged children in Kenya. They both cause enlargement of the spleen, but their relative contribution to the condition of splenomegaly remains unknown in areas where both infections are endemic. Here, we have investigated whether relatively high exposure to both infections has a clinically measurable effect on this condition.
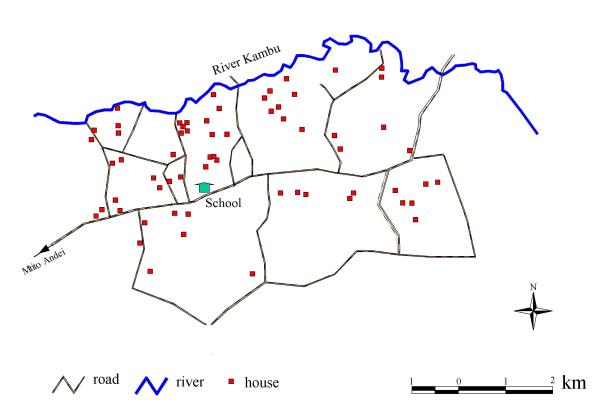
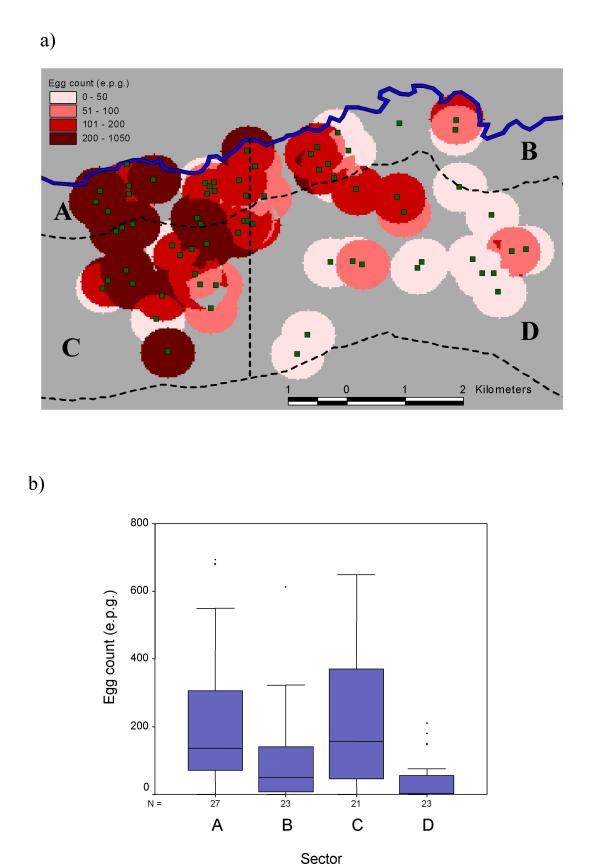
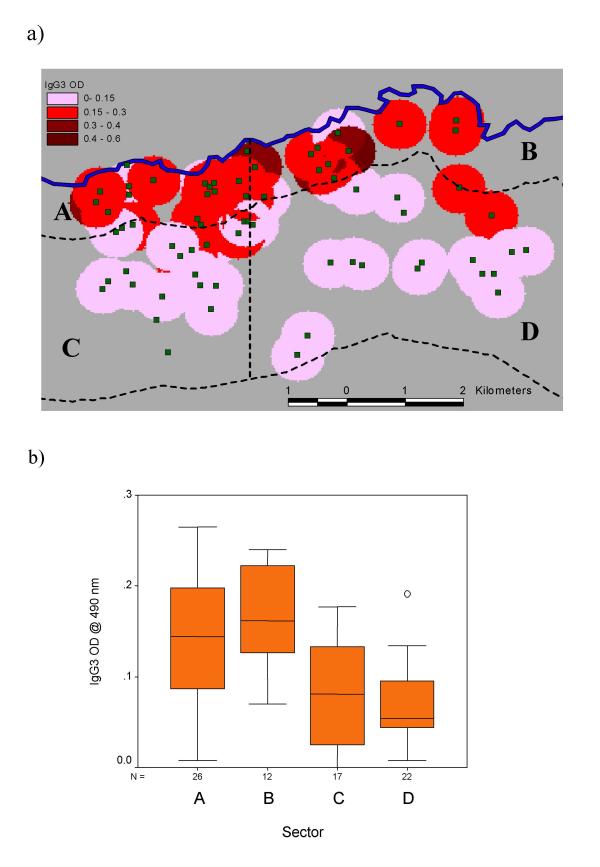
Methods: 96 children aged 6-16 years living along a ten kilometre stretch and within 4 km south of a river that is a source of both S. mansoni and malaria infections were examined clinically for splenomegaly along the mid clavicular line (MCL) and mid axillary line (MAL). The survey was conducted outside the malaria transmission season. The consistency of the organ was recorded as soft, firm or hard. Mapping of the locations of houses and the course of the river was undertaken. Egg counts were mapped at the household level, as were IgG3 responses to Plasmodium falciparum schizont antigen (anti-Pfs IgG3), in order to identify areas with relatively high exposure to both infections, either infection or neither infection. ANOVA was used to test for differences in egg counts, IgG3 levels and the magnitude of spleen enlargement between these areas.
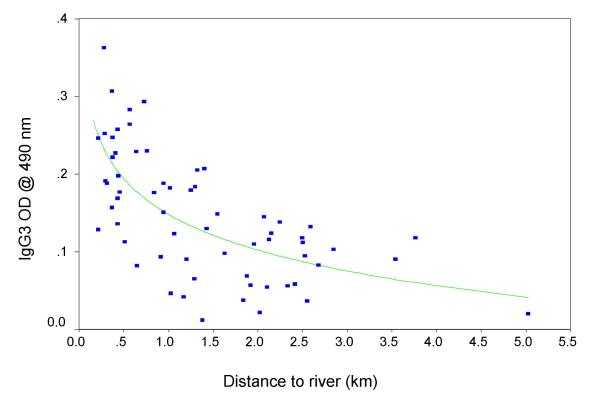
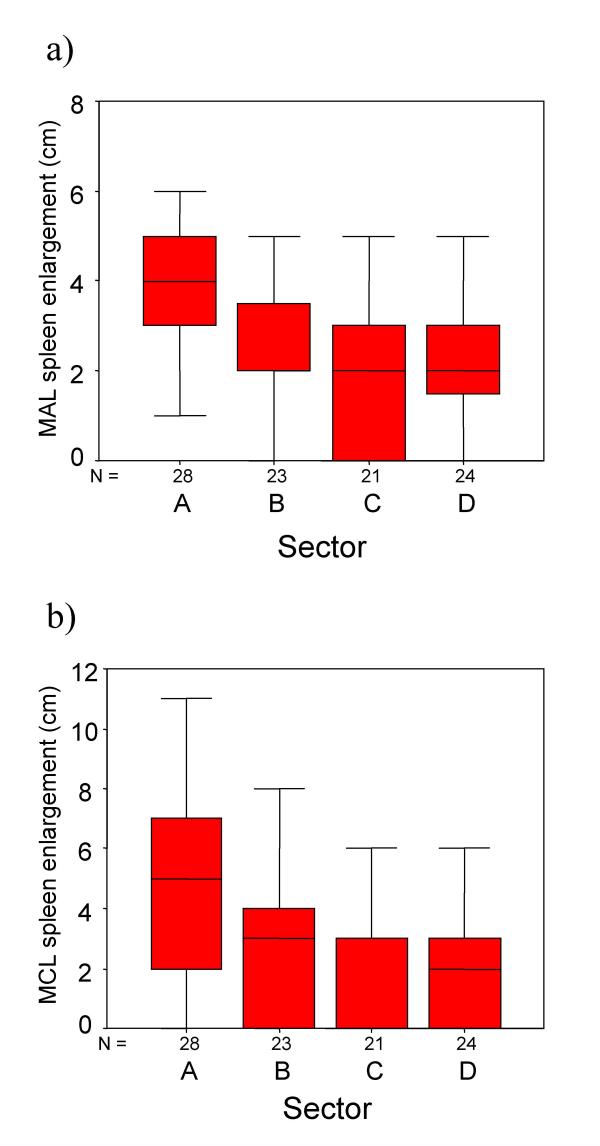
Results: 4 contiguous sectors were identified, one where anti-Pfs IgG3 responses and S. mansoni egg counts were both high, one where only anti-Pfs IgG3 responses were high, one where only egg counts were high, and one where both anti-Pfs IgG3 responses and egg counts were low. Spleen MAL and MCL values were significantly higher amongst children from the sector with highest IgG3 levels and highest egg counts but similar amongst children from elsewhere. Both egg counts and anti-Pfs IgG3 responses were significantly higher in children with MAL values > or =4 cm. Hardening of spleens was associated with proximity of domicile to the river.
Conclusions: Micro-geographical variation in exposure to S. mansoni and malaria infections can be exploited to investigate the chronic impact of these two infections. These results provide firm evidence that relatively high exposure to both infections exacerbates splenomegaly even outside the malaria transmission season. Major implications include assessing the burden of infection in school age-children.
Figures
Similar articles
-
Hepatosplenomegaly in Kenyan schoolchildren: exacerbation by concurrent chronic exposure to malaria and Schistosoma mansoni infection.Trop Med Int Health. 2007 Dec;12(12):1442-9. doi: 10.1111/j.1365-3156.2007.01950.x. Trop Med Int Health. 2007. PMID: 18076550
-
Exposure to malaria affects the regression of hepatosplenomegaly after treatment for Schistosoma mansoni infection in Kenyan children.BMC Med. 2004 Sep 27;2:36. doi: 10.1186/1741-7015-2-36. BMC Med. 2004. PMID: 15450118 Free PMC article.
-
Age-adjusted Plasmodium falciparum antibody levels in school-aged children are a stable marker of microgeographical variations in exposure to Plasmodium infection.BMC Infect Dis. 2007 Jun 29;7:67. doi: 10.1186/1471-2334-7-67. BMC Infect Dis. 2007. PMID: 17603885 Free PMC article.
-
Differences in the rate of hepatosplenomegaly due to Schistosoma mansoni infection between two areas in Machakos District, Kenya.Trans R Soc Trop Med Hyg. 1991 Jul-Aug;85(4):481-8. doi: 10.1016/0035-9203(91)90229-r. Trans R Soc Trop Med Hyg. 1991. PMID: 1755056
-
Turf wars: exploring splenomegaly in sickle cell disease in malaria-endemic regions.Br J Haematol. 2017 Jun;177(6):938-946. doi: 10.1111/bjh.14592. Epub 2017 May 11. Br J Haematol. 2017. PMID: 28493472 Free PMC article. Review.
Cited by
-
Acquired immune heterogeneity and its sources in human helminth infection.Parasitology. 2011 Feb;138(2):139-59. doi: 10.1017/S0031182010001216. Epub 2010 Oct 15. Parasitology. 2011. PMID: 20946693 Free PMC article. Review.
-
Investigation of the proteolytic functions of an expanded cercarial elastase gene family in Schistosoma mansoni.PLoS Negl Trop Dis. 2012;6(4):e1589. doi: 10.1371/journal.pntd.0001589. Epub 2012 Apr 3. PLoS Negl Trop Dis. 2012. PMID: 22509414 Free PMC article.
-
Long term study on the effect of mollusciciding with niclosamide in stream habitats on the transmission of schistosomiasis mansoni after community-based chemotherapy in Makueni District, Kenya.Parasit Vectors. 2013 Apr 18;6:107. doi: 10.1186/1756-3305-6-107. Parasit Vectors. 2013. PMID: 23596985 Free PMC article.
-
Prevalence and clinical correlates of Schistosoma mansoni co-infection among malaria infected patients, Northwest Ethiopia.BMC Res Notes. 2015 Sep 28;8:480. doi: 10.1186/s13104-015-1468-2. BMC Res Notes. 2015. PMID: 26415939 Free PMC article.
-
The health impact of polyparasitism in humans: are we under-estimating the burden of parasitic diseases?Parasitology. 2008 Jun;135(7):783-94. doi: 10.1017/S0031182008000346. Epub 2008 Mar 27. Parasitology. 2008. PMID: 18371242 Free PMC article. Review.
References
-
- Buck AA, Anderson RI, MacRae AA. Epidemiology of poly-parasitism. I. Occurrence, frequency and distribution of multiple infections in rural communities in Chad, Peru, Afghanistan, and Zaire. Tropenmed Parasitol. 1978;29:61–70. - PubMed
-
- Booth M, Bundy DA. Estimating the number of multiple-species geohelminth infections in human communities. Parasitology. 1995;111 ( Pt 5):645–653. - PubMed
-
- Nelson GS. Schistosoma mansoni infection in the West Nile District of Uganda part III. the spleen and S. mansoni infection. East African Medical Journal. 1957;35:543 –5547. - PubMed
Publication types
MeSH terms
Grants and funding
LinkOut - more resources
Full Text Sources
Medical
Research Materials
