Comparative Study
. 2004 May 17;199(10):1421-31.
doi: 10.1084/jem.20040191.

Endogenous presentation of CD8+ T cell epitopes from Epstein-Barr virus-encoded nuclear antigen 1

Affiliations
Comparative Study

Endogenous presentation of CD8+ T cell epitopes from Epstein-Barr virus-encoded nuclear antigen 1

Judy Tellam et al. J Exp Med. .

Abstract

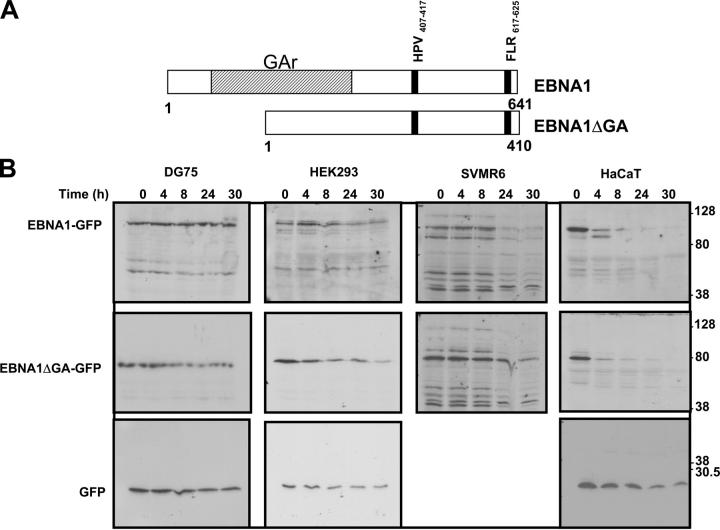
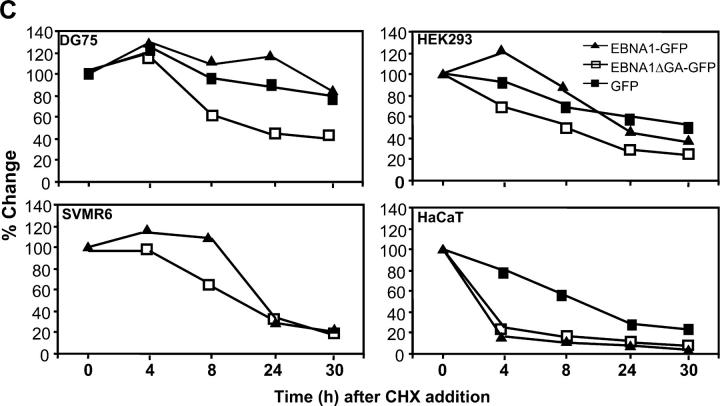
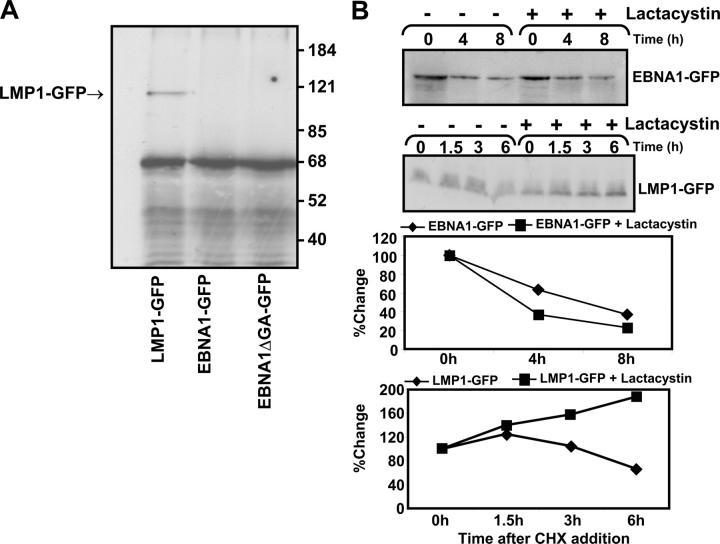
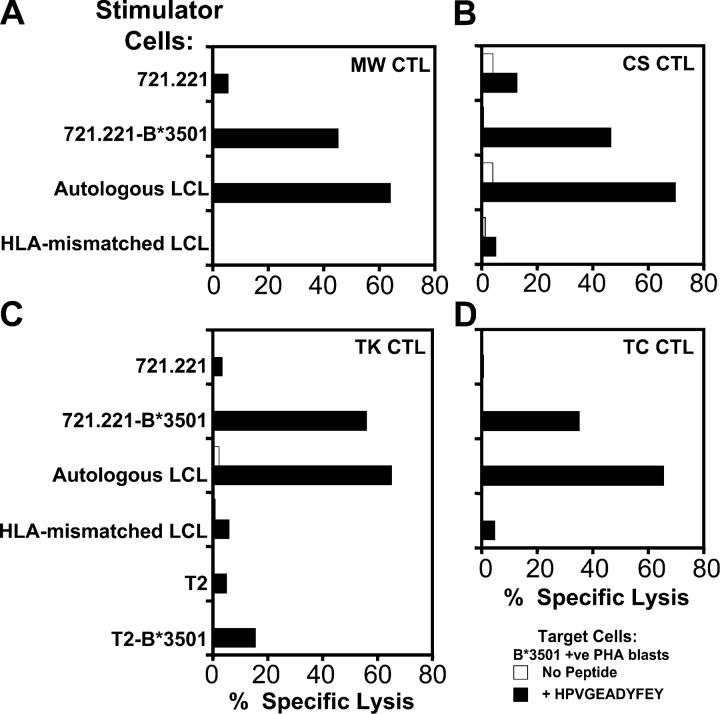
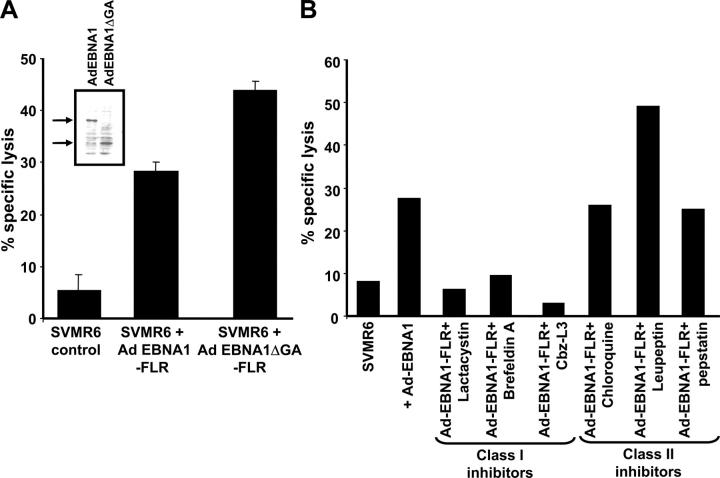
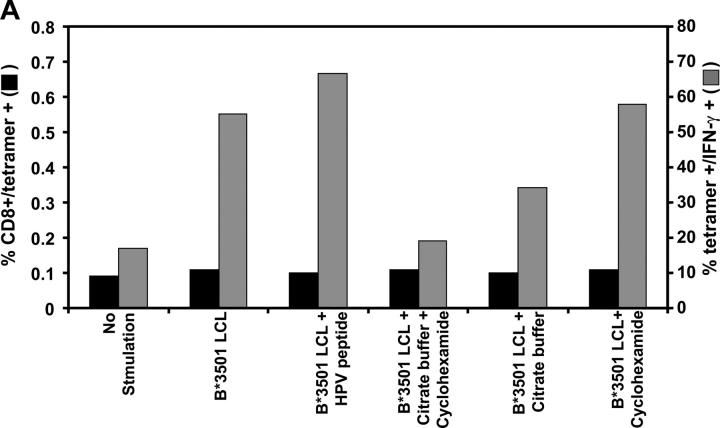
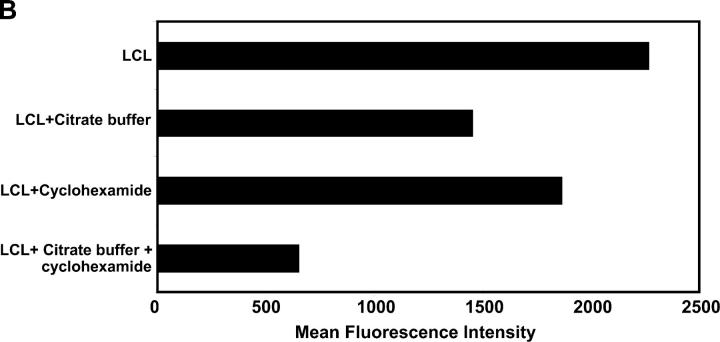
Epstein-Barr virus (EBV)-encoded nuclear antigen (EBNA)1 is thought to escape cytotoxic T lymphocyte (CTL) recognition through either self-inhibition of synthesis or by blockade of proteasomal degradation by the glycine-alanine repeat (GAr) domain. Here we show that EBNA1 has a remarkably varied cell type-dependent stability. However, these different degradation rates do not correspond to the level of major histocompatibility complex class I-restricted presentation of EBNA1 epitopes. In spite of the highly stable expression of EBNA1 in B cells, CTL epitopes derived from this protein are efficiently processed and presented to CD8+ T cells. Furthermore, we show that EBV-infected B cells can readily activate EBNA1-specific memory T cell responses from healthy virus carriers. Functional assays revealed that processing of these EBNA1 epitopes is proteasome and transporter associated with antigen processing dependent. We also show that the endogenous presentation of these epitopes is dependent on the newly synthesized protein rather than the long-lived stable EBNA1. Based on these observations, we propose that defective ribosomal products, not the full-length antigen, are the primary source of endogenously processed CD8+ T cell epitopes from EBNA1.


Figures

Figure 1.
Figure 1.
(A) Schematic description of EBNA1 and EBNA1ΔGA expression constructs showing localization of FLR and HPV epitopes. (B) Intracellular degradation of EBNA1-GFP in different cell types. DG75 B cells, HEK293 epithelial cells, SVMR6 keratinocytes, and HaCaT keratinocytes were transfected with expression constructs EBNA1-GFP, EBNA1ΔGA-GFP, or the control plasmid pEGFP-N1. At 36 h after transfection, the cells were degraded over a 30-h time course in the presence of 50 μg/ml cycloheximide as described in Materials and Methods. Molecular weight standards are indicated at the side of each panel. (C) Densitometric analysis of EBNA1-GFP, EBNA1ΔGA-GFP, and GFP expression. Band intensities were quantified by analysis of the imaging data and plotted as a relative percentage of the signal at time 0 for EBNA1-GFP, EBNA1ΔGA-GFP, and GFP.
Figure 1.
Figure 1.
(A) Schematic description of EBNA1 and EBNA1ΔGA expression constructs showing localization of FLR and HPV epitopes. (B) Intracellular degradation of EBNA1-GFP in different cell types. DG75 B cells, HEK293 epithelial cells, SVMR6 keratinocytes, and HaCaT keratinocytes were transfected with expression constructs EBNA1-GFP, EBNA1ΔGA-GFP, or the control plasmid pEGFP-N1. At 36 h after transfection, the cells were degraded over a 30-h time course in the presence of 50 μg/ml cycloheximide as described in Materials and Methods. Molecular weight standards are indicated at the side of each panel. (C) Densitometric analysis of EBNA1-GFP, EBNA1ΔGA-GFP, and GFP expression. Band intensities were quantified by analysis of the imaging data and plotted as a relative percentage of the signal at time 0 for EBNA1-GFP, EBNA1ΔGA-GFP, and GFP.
Figure 2.
Figure 2.
Ubiquitination analysis of EBNA1-GFP and EBNA1ΔGA-GFP in vitro. (A) SVMR6 keratinocytes were transiently cotransfected with expression vectors encoding HA-tagged 8xUb and LMP1-GFP, EBNA1-GFP, or EBNA1ΔGA-GFP. Ubiquitinated complexes were immunoprecipitated with an anti-HA–specific mAb and immunoblotted with anti-GFP. The ubiquitinated LMP1+ control is indicated. (B) Effect of the proteasomal inhibitor lactacystin on the stability of EBNA1-GFP and LMP1-GFP in epithelial cells. Duplicate aliquots of HaCaT cells were transfected with the expression construct EBNA1-GFP or LMP1-GFP. At 36 h after transfection, the proteasome inhibitor lactacystin was added at a final concentration of 10 μg/ml for 12 h to one of the duplicates. Both duplicates were then subjected to treatment with 50 μg/ml cycloheximide over a 6–8-h time course. Cell lysates at the indicated time points were separated by SDS-PAGE for immunoblotting with a GFP-specific antibody. The absence (−) or presence (+) of lactacystin is indicated. Densitometric analysis of the EBNA1-GFP, LMP1-GFP, EBNA1-GFP plus lactacystin, and LMP1-GFP plus lactacystin expression products are shown.
Figure 3.
Figure 3.
Direct stimulation of EBNA1-specific CTL responses in vitro using LCL stimulators. CTL bulk cultures were generated from the HLA B*3501+ EBV-seropositive donors MW, CS, TK, and TC by incubating PBMCs with irradiated LCLs (responder/stimulator ratio of 20:1). CTL cultures were split and restimulated with additional irradiated LCLs on day 7. Stimulator cells were the class I LCL 721.221, HLA B*3501-transfected 721.221 cells, the autologous LCL for each donor, or an LCL from the B*3501 donor DM. CTL cultures were also generated from donor TK after stimulation with the T2 cell line or B*3501-transfected T2 cells. On day 10, each CTL bulk culture was screened in chromium release assays for lysis of HLA B*3501+ PHA blasts that had been pretreated with 1 μM of the HPV peptide for 1 h or left untreated. An E/T ratio of 20:1 was used in each of these assays. These data are a representation of two separate experiments.
Figure 4.
Figure 4.
Ex vivo intracellular IFN-γ production by EBNA1-specific T cells after stimulation with LCLs. PBMCs from an HLA B35+ donor were incubated alone (A) or with autologous LCL (B), 0.221.B35 LCL (C), HLA B35 LCL (D), or 0.221 LCL (E). Samples shown were gated on the CD8+ population, and then the percentage of CD8+ and HPV tetramer+ cells that were producing IFN-γ was assessed. The percentage of HPV-specific T cells producing IFN-γ after LCL stimulation is shown on the top right hand corner of each of the panels. These data are a representation of two separate experiments.
Figure 5.
Figure 5.
CTL recognition of endogenously processed EBNA1 epitopes. (A) HLA B35+ and HLA B35 LCLs were used as targets in a standard 51Cr-release assay to assess endogenous processing of EBNA1. (A) A CTL clone specific for the HLA B35-binding HPVGEADYFEY epitope was added to target cells at the E/T ratios indicated. (B) An HLA B35+ LCL, 721.221 LCLs, 721.221 LCLs transfected with HLA B*3501, T2 LCLs, and T2 LCLs transfected with HLA B*3501 were used as targets in a standard 51Cr-release assay to assess CTL activity to an HPVGEADYFEY-specific CTL clone at an E/T ratio of 5:1. These data are a representation of three separate experiments.
Figure 6.
Figure 6.
Endogenous processing of an inserted HLA B8–restricted CTL epitope within EBNA1. (A) Two HLA B8+ LCLs and the same LCLs transfected with either the EBNA1-FLR-GFP or EBNA1ΔGA-FLR-GFP expression constructs were used as targets in a standard 51Cr-release assay to assess CTL activity to a B8-specific CTL clone, LC13. An E/T ratio of 5:1 was used in this assay. (B) C1R.B8 LCLs, C1R.B8.ICP47 LCLs, and the same LCLs infected with a recombinant adenovirus encoding full-length EBNA1 (Ad-EBNA1-FLR) were used as targets in a standard 51Cr-release assay to assess CTL activity. An HLA B8–restricted FLR-specific CTL clone, LC13, was used as an effector in this assay. An E/T ratio of 5:1 was used in this assay. These data are a representation of two separate experiments.
Figure 7.
Figure 7.
Endogenous processing of EBNA1 CTL epitopes in epithelial cells and the effect of MHC class I and II inhibitors on endogenous processing of EBNA1 epitopes. (A) SVMR6 cells were infected with a recombinant adenovirus expressing either full-length EBNA1-FLR or EBNA1ΔGA-FLR. These cells were used as targets in a standard 51Cr-release assay to assess endogenous processing of an HLA B8–restricted FLR epitope encoded within EBNA1. The FLR-specific CTL clone LC13 was used as effector cells in the assay. An E/T ratio of 5:1 was used in the assay. The inset gel photo shows relative expression levels of full-length AdEBNA1 and AdEBNA1ΔGA after infection of SVMR6 cells. (B) SVMR6 keratinocytes were pretreated with either class I inhibitors, 10 μg/ml lactacystin, 1 μg/ml BFA, and 10 μg/ml Cbz-L3, or class II inhibitors, 80 μM chloroquine, 100 μM leupeptin, and 50 μM pepstatin, for 45 min. The cells were then infected with a recombinant adenovirus expressing full-length EBNA1 (Ad EBNA1-FLR). At 18 h after infection, the cells were used as targets in a standard 51Cr-release assay to assess endogenous presentation of the FLR epitope. FLR-specific CTL clone LC13 was used as effector cells in the assay. An E/T ratio of 5:1 was used in the assay. This data is a representation of three separate experiments. (C) CTL recognition of EBNA1-expressing SVMR6 cells and LCLs (HLA B35+, MW LCL; or HLA B35, AS LCL) by HLA B35–restricted HPV-specific CTL clone (DY1). SVMR6 cells were transfected with an expression vector encoding the HLA B*3501 allele. Target cells were either pretreated with 100 μM leupeptin or left untreated. An E/T ratio of 5:1 was used in the assay.
Figure 7.
Figure 7.
Endogenous processing of EBNA1 CTL epitopes in epithelial cells and the effect of MHC class I and II inhibitors on endogenous processing of EBNA1 epitopes. (A) SVMR6 cells were infected with a recombinant adenovirus expressing either full-length EBNA1-FLR or EBNA1ΔGA-FLR. These cells were used as targets in a standard 51Cr-release assay to assess endogenous processing of an HLA B8–restricted FLR epitope encoded within EBNA1. The FLR-specific CTL clone LC13 was used as effector cells in the assay. An E/T ratio of 5:1 was used in the assay. The inset gel photo shows relative expression levels of full-length AdEBNA1 and AdEBNA1ΔGA after infection of SVMR6 cells. (B) SVMR6 keratinocytes were pretreated with either class I inhibitors, 10 μg/ml lactacystin, 1 μg/ml BFA, and 10 μg/ml Cbz-L3, or class II inhibitors, 80 μM chloroquine, 100 μM leupeptin, and 50 μM pepstatin, for 45 min. The cells were then infected with a recombinant adenovirus expressing full-length EBNA1 (Ad EBNA1-FLR). At 18 h after infection, the cells were used as targets in a standard 51Cr-release assay to assess endogenous presentation of the FLR epitope. FLR-specific CTL clone LC13 was used as effector cells in the assay. An E/T ratio of 5:1 was used in the assay. This data is a representation of three separate experiments. (C) CTL recognition of EBNA1-expressing SVMR6 cells and LCLs (HLA B35+, MW LCL; or HLA B35, AS LCL) by HLA B35–restricted HPV-specific CTL clone (DY1). SVMR6 cells were transfected with an expression vector encoding the HLA B*3501 allele. Target cells were either pretreated with 100 μM leupeptin or left untreated. An E/T ratio of 5:1 was used in the assay.
Figure 8.
Figure 8.
(A) Effect of MHC–peptide stripping and cycloheximide treatment on ex vivo intracellular IFN-γ production by EBNA1-specific T cells. PBMCs from an HLA B35+ donor were incubated alone or with either an HLA B*3501+ LCL, an HLA B*3501+ LCL plus 0.01 μM HPV peptide, an HLA B*3501+ LCL treated with citrate buffer and 50 μM cycloheximide, an HLA B*3501+ LCL treated with citrate buffer, or an HLA LHLA B*3501+ LCL treated with cycloheximide. Data shown represents the CD8+ and tetramer+ population (solid bars) and the tetramer+ population producing IFN-γ (shaded bars). This data is a representation of two separate experiments. (B) Surface MHC class I expression on untreated LCLs or LCLs treated with either cycloheximide, citrate buffer alone, or cycloheximide and citrate buffer. LCLs were initially incubated with MHC class I–specific mAb (W6/32) followed by incubation with FITC-labeled anti–mouse Ig. The fluorescence intensity was measured by FACSCalibur™ and data were analyzed by CELLQuest™ software. The results are expressed as mean fluorescence intensity.
Figure 8.
Figure 8.
(A) Effect of MHC–peptide stripping and cycloheximide treatment on ex vivo intracellular IFN-γ production by EBNA1-specific T cells. PBMCs from an HLA B35+ donor were incubated alone or with either an HLA B*3501+ LCL, an HLA B*3501+ LCL plus 0.01 μM HPV peptide, an HLA B*3501+ LCL treated with citrate buffer and 50 μM cycloheximide, an HLA B*3501+ LCL treated with citrate buffer, or an HLA LHLA B*3501+ LCL treated with cycloheximide. Data shown represents the CD8+ and tetramer+ population (solid bars) and the tetramer+ population producing IFN-γ (shaded bars). This data is a representation of two separate experiments. (B) Surface MHC class I expression on untreated LCLs or LCLs treated with either cycloheximide, citrate buffer alone, or cycloheximide and citrate buffer. LCLs were initially incubated with MHC class I–specific mAb (W6/32) followed by incubation with FITC-labeled anti–mouse Ig. The fluorescence intensity was measured by FACSCalibur™ and data were analyzed by CELLQuest™ software. The results are expressed as mean fluorescence intensity.

Similar articles

Cited by

References

    1. Doherty, P.C., J.P. Christensen, G.T. Belz, P.G. Stevenson, and M.Y. Sangster. 2001. Dissecting the host response to a gamma-herpesvirus. Philos. Trans. R. Soc. Lond. B Biol. Sci. 356:581–593. - PMC - PubMed
    1. Benoist, C., and D. Mathis. 1992. Generation of the alpha beta T-cell repertoire. Curr. Opin. Immunol. 4:156–161. - PubMed
    1. Khanna, R., and S.R. Burrows. 2000. Role of cytotoxic T lymphocytes in Epstein-Barr virus-associated diseases. Annu. Rev. Microbiol. 54:19–48. - PubMed
    1. Tortorella, D., B.E. Gewurz, M.H. Furman, D.J. Schust, and H.L. Ploegh. 2000. Viral subversion of the immune system. Annu. Rev. Immunol. 18:861–926. - PubMed
    1. Murray, R.J., M.G. Kurilla, J.M. Brooks, W.A. Thomas, M. Rowe, E. Kieff, and A.B. Rickinson. 1992. Identification of target antigens for the human cytotoxic T-cell response to Epstein-Barr virus (EBV): implications for the immune control of EBV-positive malignancies. J. Exp. Med. 176:157–168. - PMC - PubMed

Publication types

MeSH terms