. 2004 May 25;101(21):7965-70.
doi: 10.1073/pnas.0308045101. Epub 2004 May 17.

Membrane growth can generate a transmembrane pH gradient in fatty acid vesicles

Affiliations

Membrane growth can generate a transmembrane pH gradient in fatty acid vesicles

Irene A Chen et al. Proc Natl Acad Sci U S A. .

Abstract

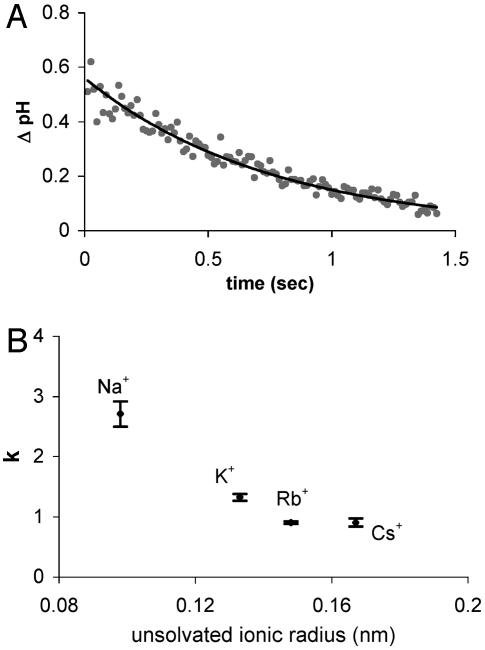
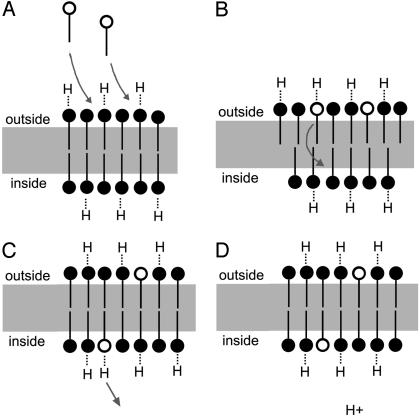
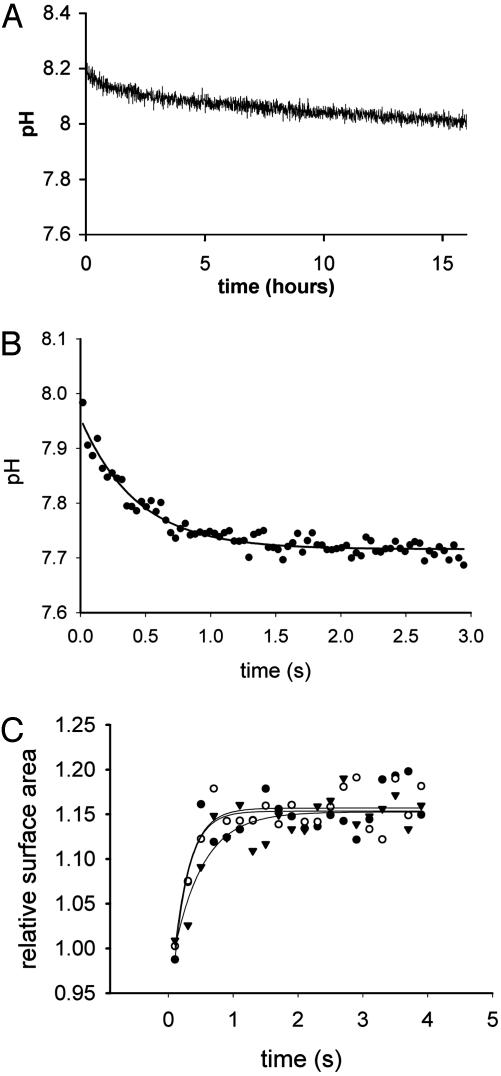
Electrochemical proton gradients are the basis of energy transduction in modern cells, and may have played important roles in even the earliest cell-like structures. We have investigated the conditions under which pH gradients are maintained across the membranes of fatty acid vesicles, a model of early cell membranes. We show that pH gradients across such membranes decay rapidly in the presence of alkali-metal cations, but can be maintained in the absence of permeable cations. Under such conditions, when fatty acid vesicles grow through the incorporation of additional fatty acid, a transmembrane pH gradient is spontaneously generated. The formation of this pH gradient captures some of the energy released during membrane growth, but also opposes and limits further membrane area increase. The coupling of membrane growth to energy storage could have provided a growth advantage to early cells, once the membrane composition had evolved to allow the maintenance of stable pH gradients.


Figures

Fig. 1.
Fig. 1.
pH gradient decay in oleate vesicles prepared with alkali metal cations. (A) Time course of pH gradient decay for oleate vesicles prepared with K+-bicine at pH 8.5, diluted to pH 8. The line is an exponential fit to: ΔpH = 0.56e–1.32 t; r2 = 0.95. (B) Plot of first-order rate constant k of pH gradient decay in vesicles vs. unsolvated ionic radius; the radius reflects the strength of coulombic attraction at the inner Helmholtz plane of the membrane (–46). Error bars are SD from replicates.
Fig. 2.
Fig. 2.
Model of growth resulting in acidification of the vesicle interior. (A) Fatty acid is added to the exterior of the vesicle to initiate growth. Near the pKa of fatty acid in the membrane, roughly half are protonated and half are negatively charged. Negative charges are not shown for clarity. (B) Fatty acid is incorporated into the outer leaflet of the vesicle bilayer. (C) Approximately half of the incorporated fatty acid flip-flops into the inner leaflet to maintain mass balance. Because the fatty acid is electrically neutral when protonated, the protonated form is preferentially transferred through the hydrophobic membrane. (D) Inside the vesicle, the fatty acid equilibrates to the pH of the solution, i.e., approximately half of the transferred fatty acid releases a proton into solution inside the vesicle. In order for these events to result in overall acidification of the vesicle interior, the membrane must be relatively impermeable to other cations in solution.
Fig. 3.
Fig. 3.
Acidification during growth of oleate-arginine vesicles. (A) Vesicles prepared at pH 8.2 were diluted to a final pH of 7.7. Oleate-arginine vesicles were observed to have a range of pH stability ≈0.3 pH units lower than vesicles prepared with alkali ions. The fast initial drop of ≈0.06 pH units may be due to trace amounts of metal cations or other impurities. (B) Typical pH drop observed during growth after addition of one equivalent of oleate micelles. In this case, the vesicle interior and exterior were initially buffered at pH 8.0 with 0.2 M arginine-bicine. The line is an exponential decay curve; parameters are given in Table 2. (C) Relative surface area of vesicles during growth, after adding one equivalent of oleate micelles. Initially, the interior pH of these vesicles was 8.1 and the exterior pH was 7.2. Three trials are shown, and each line represents a single exponential curve fit. Average growth = 15%; average rate constant = 3.7 s–1.
Fig. 4.
Fig. 4.
Determination of the cac by 90° static light scattering. ln(photon intensity) vs. ln(concentration of oleate) in 0.2 M bicine, pH 8.5. Straight lines were fit to the low-concentration micelle regime and high-concentration vesicle regime. The point of intersection was used to estimate the cac (82 μM).

References

    1. Walde, P., Wick, R., Fresta, M., Mangone, A. & Luisi, P. L. (1994) J. Am. Chem. Soc. 116, 11649–11654.
    1. Berclaz, N., Muller, M., Walde, P. & Luisi, P. L. (2001) J. Phys. Chem. B 105, 1056–1064.
    1. Hanczyc, M. M., Fujikawa, S. M. & Szostak, J. W. (2003) Science 302, 618–622. - PMC - PubMed
    1. Szathmary, E. & Demeter, L. (1987) J. Theor. Biol. 128, 463–486. - PubMed
    1. Chakrabarti, A. C., Breaker, R. R., Joyce, G. F. & Deamer, D. W. (1994) J. Mol. Evol. 39, 555–559. - PubMed

Publication types

LinkOut - more resources