

The lifetime distribution of health care costs
- PMID: 15149482
- PMCID: PMC1361028
- DOI: 10.1111/j.1475-6773.2004.00248.x
The lifetime distribution of health care costs
Abstract
Objective: To estimate the magnitude and age distribution of lifetime health care expenditures.
Data sources: Claims data on 3.75 million Blue Cross Blue Shield of Michigan members, and data from the Medicare Current Beneficiary Survey, the Medical Expenditure Panel Survey, the Michigan Mortality Database, and Michigan nursing home patient counts.
Data collection: Data were aggregated and summarized in year 2000 dollars by service, age, and gender.
Study design: We use life table models to simulate a typical lifetime's distribution of expenditures, employing cross-sectional data on age- and sex-specific health care costs and the mortality experience of the population. We determine remaining lifetime expenditures at each age for all initial members of a birth cohort. Separately, we calculate remaining expenditures for survivors at all ages. Using cross-sectional data, the analysis holds disease incidence, medical technology, and health care prices constant, thus permitting an exclusive focus on the role of age in health care costs.
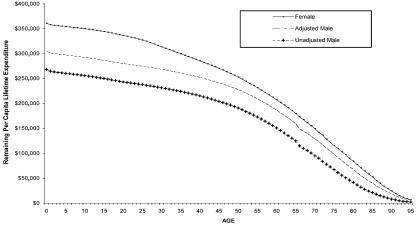
Principal findings: Per capita lifetime expenditure is USD $316,600, a third higher for females (USD $361,200) than males (USD $268,700). Two-fifths of this difference owes to women's longer life expectancy. Nearly one-third of lifetime expenditures is incurred during middle age, and nearly half during the senior years. For survivors to age 85, more than one-third of their lifetime expenditures will accrue in their remaining years.
Conclusions: Given the essential demographic phenomenon of our time, the rapid aging of the population, our findings lend increased urgency to understanding and addressing the interaction between aging and health care spending.
Figures
References
-
- Alemayehu B. Doctoral dissertation. Ann Arbor: University of Michigan; 2001. “The Lifetime Distribution of Healthcare Costs.”.
-
- Bradford D F, Max D A. Cambridge, MA: National Bureau of Economic Research; 1996. “Implicit Budget Deficits: The Case of a Mandated Shift to Community-Rated Health Insurance.”. NBER working paper no. 5514.
-
- Chelluri L, Pinsky M R, Donahoe M P, Grenvik A. “Long-term Outcome of Critically Ill Elderly Patients Requiring Intensive Care.”. Journal of the American Medical Association. 1993;269(24):3119–23. - PubMed
-
- Dunlop W E, Rosenblood L, Lawrason L, Birdsall L, Rusnak C H. “Effects of Age and Severity of Illness on Outcome and Length of Stay in Geriatric Surgical Patients.”. American Journal of Surgery. 1993;165(5):577–80. - PubMed
-
- Fuchs V. Cambridge, MA: National Bureau of Economic Research; 1998. “Provide, Provide: The Economics of Aging.”. NBER working paper no. 6642.
MeSH terms
LinkOut - more resources
Full Text Sources
Other Literature Sources
