nsd, a locus that affects the Myxococcus xanthus cellular response to nutrient concentration
- PMID: 15150233
- PMCID: PMC415774
- DOI: 10.1128/JB.186.11.3461-3471.2004
nsd, a locus that affects the Myxococcus xanthus cellular response to nutrient concentration
Abstract
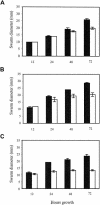
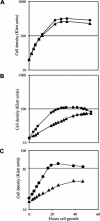
Expression of the previously reported Tn5lac Omega4469 insertion in Myxococcus xanthus cells is regulated by the starvation response. Interested in learning more about the starvation response, we cloned and sequenced the region containing the insertion. Our analysis shows that the gene fusion is located in an open reading frame that we have designated nsd (nutrient sensing/utilizing defective) and that its expression is driven by a sigma70-like promoter. Sequence analysis of the nsd gene product provides no information on the potential structure or function of the encoded protein. In a further effort to learn about the role of nsd in the starvation response, we closely examined the phenotype of cells carrying the nsd::Tn5lac Omega4469 mutation. Our analysis showed that these cells initiate development on medium that contains nutrients sufficient to sustain vegetative growth of wild-type cells. Furthermore, in liquid media these same nutrient concentrations elicit a severe impairment of growth of nsd cells. The data suggest that the nsd cells launch a starvation response when there are enough nutrients to prevent one. In support of this hypothesis, we found that, when grown in these nutrient concentrations, nsd cells accumulate guanosine tetraphosphate, the cellular starvation signal. Therefore, we propose that nsd is used by cells to respond to available nutrient levels.
Figures


Similar articles
-
Characterization of the regulatory region of a cell interaction-dependent gene in Myxococcus xanthus.J Bacteriol. 1996 May;178(9):2539-50. doi: 10.1128/jb.178.9.2539-2550.1996. J Bacteriol. 1996. PMID: 8626320 Free PMC article.
-
Identification of the Omega4499 regulatory region controlling developmental expression of a Myxococcus xanthus cytochrome P-450 system.J Bacteriol. 1999 Sep;181(17):5467-75. doi: 10.1128/JB.181.17.5467-5475.1999. J Bacteriol. 1999. PMID: 10464222 Free PMC article.
-
Myxococcus xanthus sasN encodes a regulator that prevents developmental gene expression during growth.J Bacteriol. 1998 Dec;180(23):6215-23. doi: 10.1128/JB.180.23.6215-6223.1998. J Bacteriol. 1998. PMID: 9829930 Free PMC article.
-
Intercellular signaling during fruiting-body development of Myxococcus xanthus.Annu Rev Microbiol. 1999;53:525-49. doi: 10.1146/annurev.micro.53.1.525. Annu Rev Microbiol. 1999. PMID: 10547700 Review.
-
Dual regulation with Ser/Thr kinase cascade and a His/Asp TCS in Myxococcus xanthus.Adv Exp Med Biol. 2008;631:111-21. doi: 10.1007/978-0-387-78885-2_7. Adv Exp Med Biol. 2008. PMID: 18792684 Review.
Cited by
-
Transcription factor MrpC binds to promoter regions of hundreds of developmentally-regulated genes in Myxococcus xanthus.BMC Genomics. 2014 Dec 16;15:1123. doi: 10.1186/1471-2164-15-1123. BMC Genomics. 2014. PMID: 25515642 Free PMC article.
-
Identification of a putative flavin adenine dinucleotide-binding monooxygenase as a regulator for Myxococcus xanthus development.J Bacteriol. 2015 Apr;197(7):1185-96. doi: 10.1128/JB.02555-14. Epub 2015 Jan 20. J Bacteriol. 2015. PMID: 25605309 Free PMC article.
-
Deletion of an sRNA primes development in a multicellular bacterium.iScience. 2025 Feb 12;28(3):111980. doi: 10.1016/j.isci.2025.111980. eCollection 2025 Mar 21. iScience. 2025. PMID: 40124474 Free PMC article.
References
-
- Barker, M. M., T. Gaal, and R. L. Gourse. 2001. Mechanism of regulation of transcription initiation by ppGpp. II. Model for positive control based on properties of RNAP mutants and competition for RNAP. J. Mol. Biol. 305:689-702. - PubMed
-
- Barker, M. M., T. Gaal, C. A. Josaitis, and R. L. Gourse. 2001. Mechanism of regulation of transcription initiation by ppGpp. I. Effects of ppGpp on transcription initiation in vivo and in vitro. J. Mol. Biol. 305:673-688. - PubMed
-
- Bradford, M. 1976. A rapid and sensitive method for quantitation of microgram quantities of protein utilizing the principle of protein-dye binding. Anal. Biochem. 72:248-254. - PubMed
-
- Cashel, M., D. Gentry, J. Hernandez, and D. Vinella. 1996. The stringent response, p. 1458-1496. In F. C. Neidhardt, R. Curtiss III, J. L. Ingraham, E. C. C. Lin, K. B. Low, B. Magasanik, W. S. Reznikoff, M. Riley, M. Schaechter, and H. E. Umbarger (ed.), Escherichia coli and Salmonella: cellular and molecular biology, 2nd ed., vol. 1. ASM Press, Washington, D.C.
Publication types
MeSH terms
Substances
Grants and funding
LinkOut - more resources
Full Text Sources

