

Phi-value analysis and the nature of protein-folding transition states
- PMID: 15150406
- PMCID: PMC419542
- DOI: 10.1073/pnas.0402684101
Phi-value analysis and the nature of protein-folding transition states
Abstract
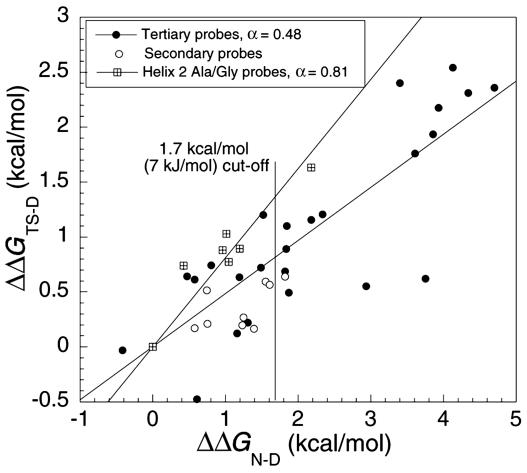
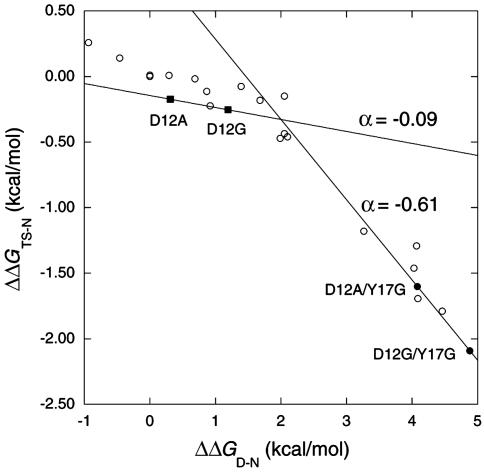
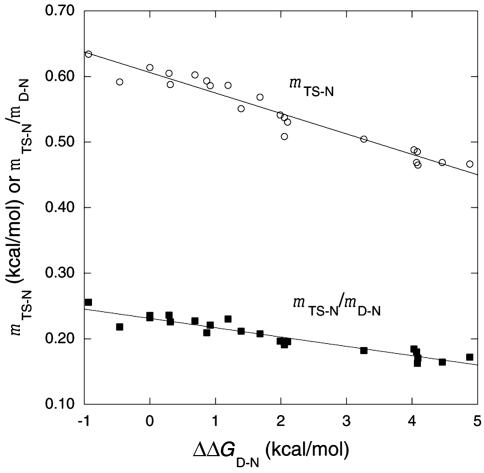
Phi values are used to map structures of protein-folding transition states from changes in free energies of denaturation (DeltaDeltaG(D-N)) and activation on mutation. A recent reappraisal proposed that Phi values for DeltaDeltaG(D-N) < 1.7 kcal/mol are artifactual. On discarding such derived Phi values from published studies, the authors concluded that there are no high Phi values in diffuse transition states, which are consequently uniformly diffuse with no evidence for nucleation. However, values of DeltaDeltaG(D-N) > 1.7 kcal/mol are often found for large side chains that make dispersed tertiary interactions, especially in hydrophobic cores that are in the process of being formed in the transition state. Conversely, specific local interactions that probe secondary structure tend to have DeltaDeltaG(D-N) approximately 0.5-2 kcal/mol. Discarding Phi values from lower-energy changes discards the crucial information about local interactions and makes transition states appear uniformly diffuse by overemphasizing the dispersed tertiary interactions. The evidence for the 1.7 kcal/mol cutoff was based on mutations that had been deliberately designed to be unsuitable for Phi-value analysis because they are structurally disruptive. We confirm that reliable Phi values can be derived from the recommended mutations in suitable proteins with 0.6 < DeltaDeltaG(D-N) < 1.7 kcal/mol, and there are many reliable high Phi values. Transition states vary from being rather diffuse to being well formed with islands of near-complete secondary structure. We also confirm that the structures of transition-state ensembles can be perturbed by mutations with DeltaDeltaG(D-N) >> 2 kcal/mol and that protein-folding transition states do move on the energy surface on mutation.
Figures
Similar articles
-
Insights into protein folding mechanisms from large scale analysis of mutational effects.Proc Natl Acad Sci U S A. 2010 May 11;107(19):8611-6. doi: 10.1073/pnas.1000988107. Epub 2010 Apr 23. Proc Natl Acad Sci U S A. 2010. PMID: 20418505 Free PMC article.
-
From covalent transition states in chemistry to noncovalent in biology: from β- to Φ-value analysis of protein folding.Q Rev Biophys. 2024 Mar 20;57:e4. doi: 10.1017/S0033583523000045. Q Rev Biophys. 2024. PMID: 38597675 Review.
-
Transition-states in protein folding kinetics: the structural interpretation of Phi values.J Mol Biol. 2007 Feb 2;365(5):1578-86. doi: 10.1016/j.jmb.2006.10.082. Epub 2006 Oct 28. J Mol Biol. 2007. PMID: 17141267
-
The transition state of the ras binding domain of Raf is structurally polarized based on Phi-values but is energetically diffuse.J Mol Biol. 2007 Feb 2;365(5):1559-77. doi: 10.1016/j.jmb.2006.10.079. Epub 2006 Oct 28. J Mol Biol. 2007. PMID: 17137592
-
Mutational investigation of protein folding transition states by Phi-value analysis and beyond: lessons from SH3 domain folding.Biochem Cell Biol. 2010 Apr;88(2):231-8. doi: 10.1139/o09-153. Biochem Cell Biol. 2010. PMID: 20453926 Review.
Cited by
-
Importance of electrostatic interactions in the association of intrinsically disordered histone chaperone Chz1 and histone H2A.Z-H2B.PLoS Comput Biol. 2012;8(7):e1002608. doi: 10.1371/journal.pcbi.1002608. Epub 2012 Jul 12. PLoS Comput Biol. 2012. PMID: 22807669 Free PMC article.
-
Influence of hPin1 WW N-terminal domain boundaries on function, protein stability, and folding.Protein Sci. 2007 Jul;16(7):1495-501. doi: 10.1110/ps.072775507. Protein Sci. 2007. PMID: 17586778 Free PMC article.
-
Relationship of Leffler (Bronsted) alpha values and protein folding Phi values to position of transition-state structures on reaction coordinates.Proc Natl Acad Sci U S A. 2004 Oct 5;101(40):14338-42. doi: 10.1073/pnas.0406091101. Epub 2004 Sep 21. Proc Natl Acad Sci U S A. 2004. PMID: 15383660 Free PMC article.
-
The contribution of the residues from the main hydrophobic core of ribonuclease A to its pressure-folding transition state.Protein Sci. 2006 May;15(5):1000-9. doi: 10.1110/ps.052050306. Epub 2006 Apr 5. Protein Sci. 2006. PMID: 16597833 Free PMC article.
-
Investigating the Effect of Chain Connectivity on the Folding of a Beta-Sheet Protein On and Off the Ribosome.J Mol Biol. 2018 Dec 7;430(24):5207-5216. doi: 10.1016/j.jmb.2018.10.011. Epub 2018 Oct 23. J Mol Biol. 2018. PMID: 30365950 Free PMC article.
References
-
- Fersht, A. R., Leatherbarrow, R. J. & Wells, T. N. C. (1986) Nature 322, 284–286.
-
- Fersht, A. R., Leatherbarrow, R. & Wells, T. N. C. (1987) Biochemistry 26, 6030–6038. - PubMed
-
- Matouschek, A., Kellis, J. T., Jr., Serrano, L. & Fersht, A. R. (1989) Nature 340, 122–126. - PubMed
-
- Fersht, A. R., Matouschek, A. & Serrano, L. (1992) J. Mol. Biol. 224, 771–782. - PubMed
MeSH terms
Substances
LinkOut - more resources
Full Text Sources
Other Literature Sources
