

Effects of tumour acidification with glucose+MIBG on the spontaneous metastatic potential of two murine cell lines
- PMID: 15150590
- PMCID: PMC2409743
- DOI: 10.1038/sj.bjc.6601766
Effects of tumour acidification with glucose+MIBG on the spontaneous metastatic potential of two murine cell lines
Abstract
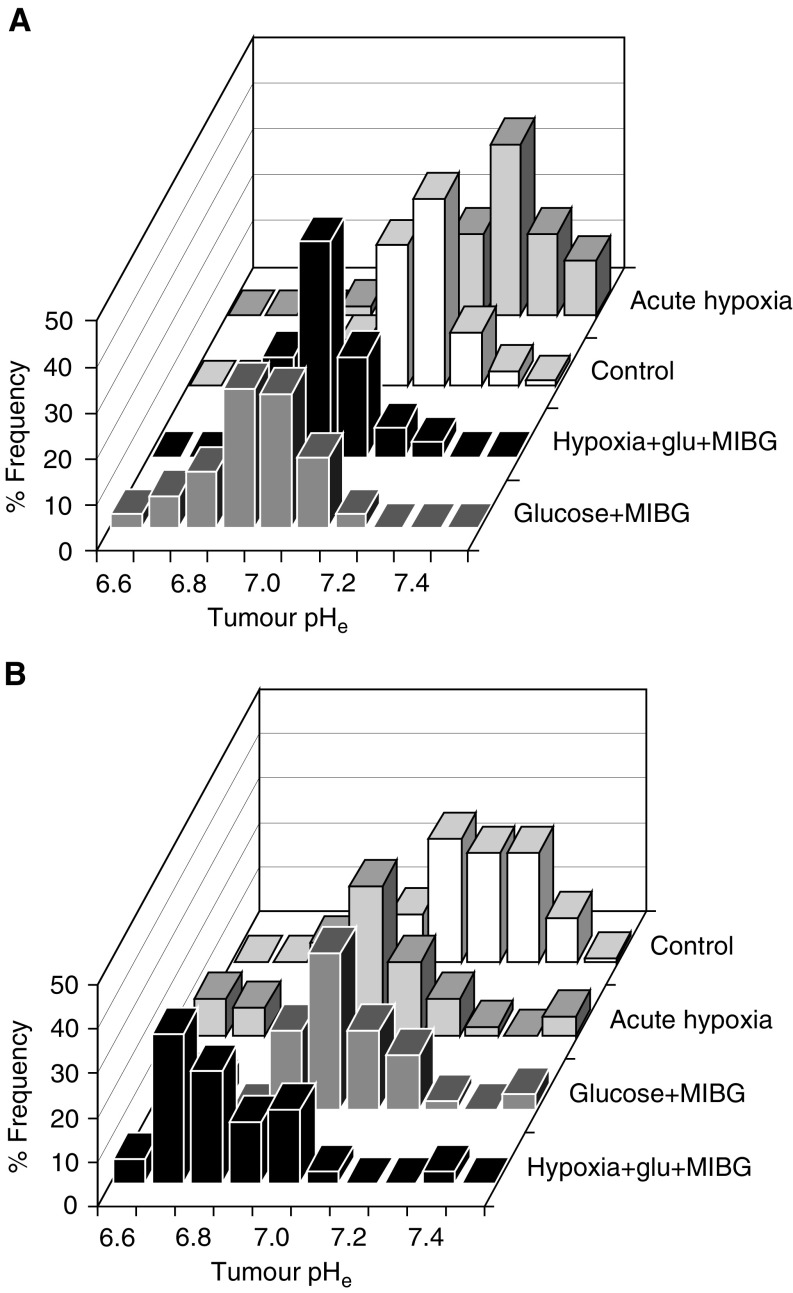
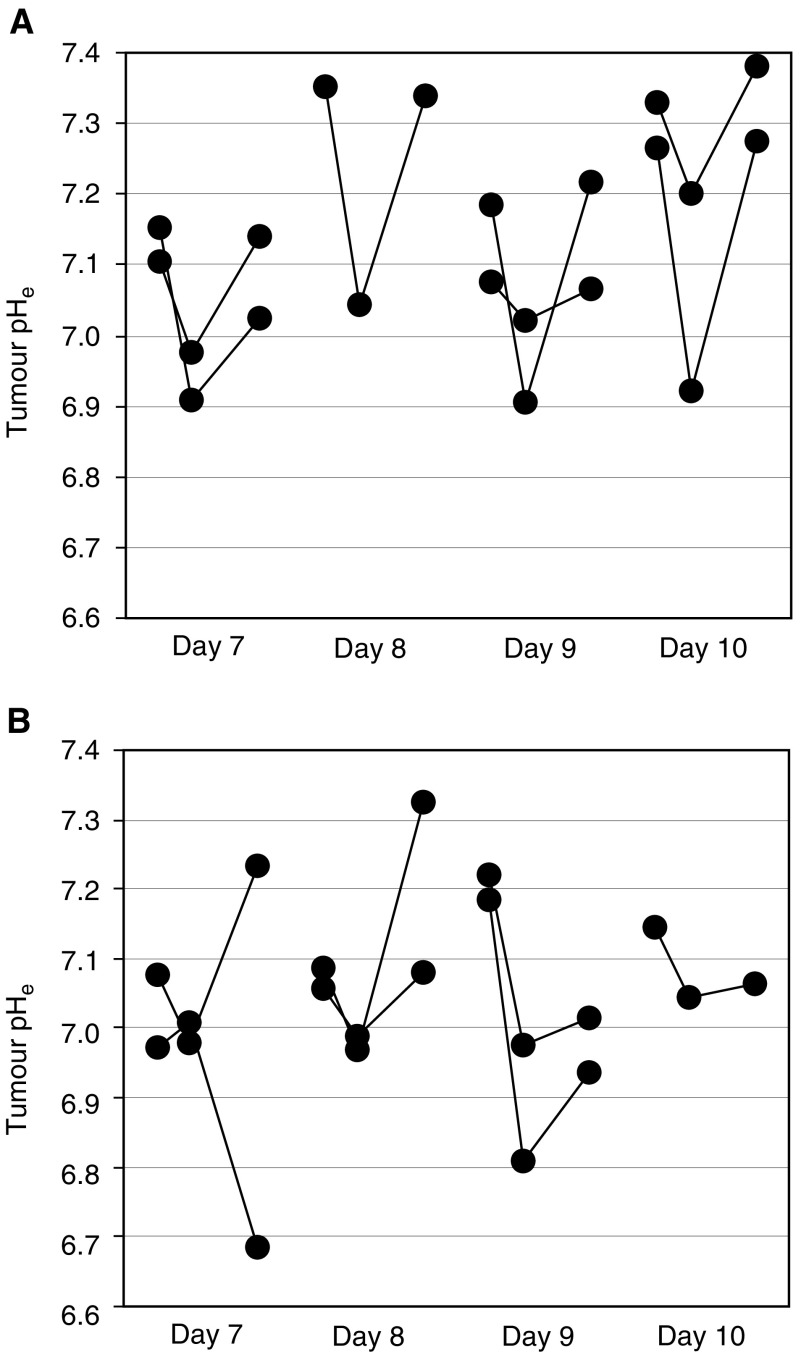
In addition to hypoxia, acidic extracellular pH (pH(e)) is recognised as one of the microenvironmental characteristics of solid tumours. A number of studies have examined ways to increase tumour acidity in order to improve tumour-specific targeting of certain drugs and the effectiveness of hyperthermia. However, previous data have shown that exposure of murine tumour cells to acid conditions in culture can enhance their metastatic potential when injected subsequently into mice, raising the concern that deliberate tumour acidification might increase the probability of metastasis. In this study, we examined the effects of in vivo tumour acidification and hypoxia on the spontaneous metastatic potential of the murine KHT-C fibrosarcoma and B16F1 melanoma cell lines. A tumour-specific increase in extracellular acidity, demonstrated by measurements with pH electrodes, was achieved by daily intraperitoneal injections of meta-iodo-benzylguanidine (MIBG) and/or glucose. This method of tumour acidification during tumour growth did not significantly enhance the spontaneous metastatic potential of the two murine cell lines.
Figures
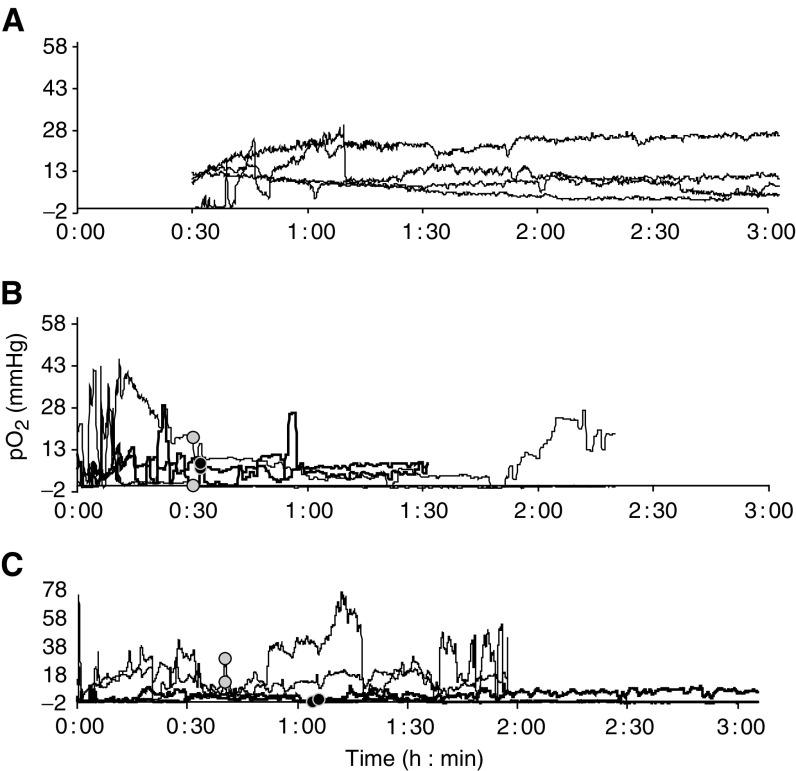
 , and continued for 1–2 h after treatment. (C) B16F1 tumours (N=2); measurements were started prior to injections, marked by • and
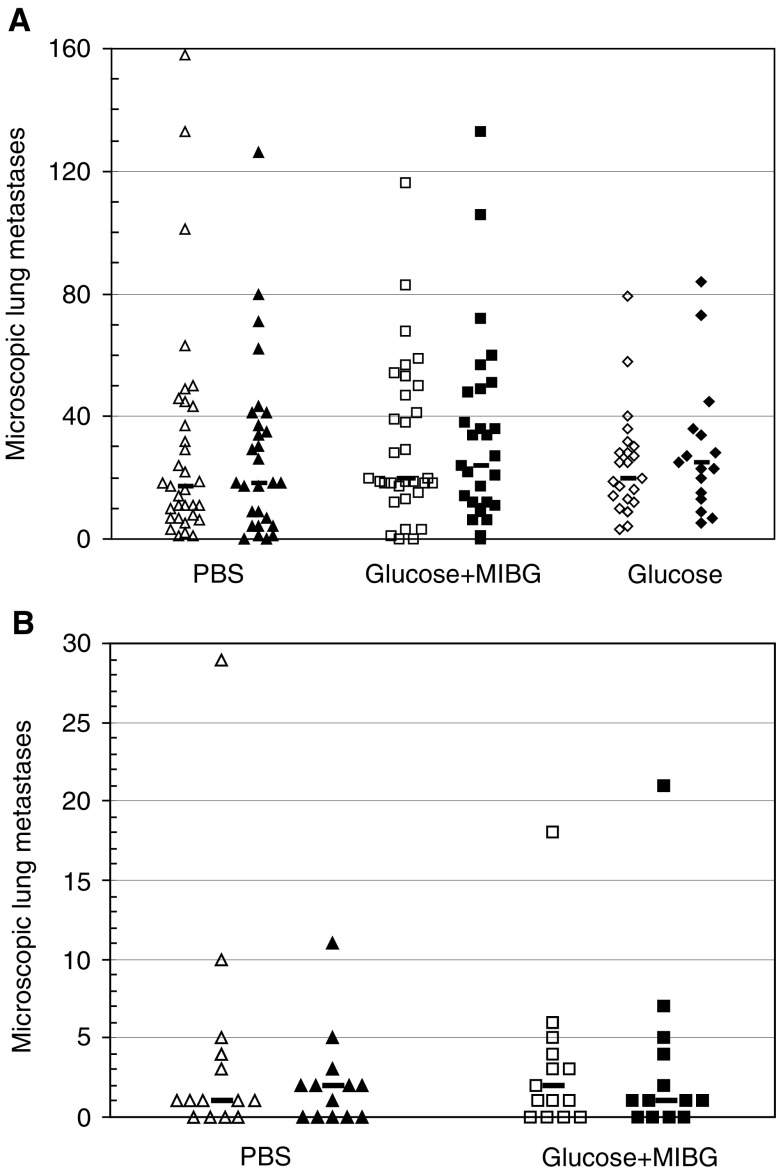
Similar articles
-
Potentiation of anti-cancer drug activity at low intratumoral pH induced by the mitochondrial inhibitor m-iodobenzylguanidine (MIBG) and its analogue benzylguanidine (BG).Br J Cancer. 1999 Feb;79(5-6):793-801. doi: 10.1038/sj.bjc.6690127. Br J Cancer. 1999. PMID: 10070871 Free PMC article.
-
Glucose starvation and acidosis: effect on experimental metastatic potential, DNA content and MTX resistance of murine tumour cells.Br J Cancer. 1991 Oct;64(4):663-70. doi: 10.1038/bjc.1991.378. Br J Cancer. 1991. PMID: 1911214 Free PMC article.
-
Exposure to hypoxia, glucose starvation and acidosis: effect on invasive capacity of murine tumor cells and correlation with cathepsin (L + B) secretion.Clin Exp Metastasis. 1997 Jan;15(1):19-25. doi: 10.1023/a:1018428105463. Clin Exp Metastasis. 1997. PMID: 9009102
-
Microenvironmental and cellular consequences of altered blood flow in tumours.Br J Radiol. 2003;76 Spec No 1:S11-22. doi: 10.1259/bjr/12913493. Br J Radiol. 2003. PMID: 15456710 Review.
-
pH, hypoxia and metastasis.Novartis Found Symp. 2001;240:154-65; discussion 165-8. doi: 10.1002/0470868716.ch11. Novartis Found Symp. 2001. PMID: 11727927 Review.
Cited by
-
The Role of microRNAs in Gene Expression and Signaling Response of Tumor Cells to an Acidic Environment.Int J Mol Sci. 2023 Nov 29;24(23):16919. doi: 10.3390/ijms242316919. Int J Mol Sci. 2023. PMID: 38069241 Free PMC article.
-
The tumor microenvironment and metastatic disease.Clin Exp Metastasis. 2009;26(1):19-34. doi: 10.1007/s10585-008-9182-2. Epub 2008 Jun 10. Clin Exp Metastasis. 2009. PMID: 18543068 Review.
-
Delivery of Chemotherapy Agents and Nucleic Acids with pH-Dependent Nanoparticles.Pharmaceutics. 2023 May 12;15(5):1482. doi: 10.3390/pharmaceutics15051482. Pharmaceutics. 2023. PMID: 37242725 Free PMC article. Review.
-
Tumor Acidosis and Hypoxia Differently Modulate the Inflammatory Program: Measurements In Vitro and In Vivo.Neoplasia. 2017 Dec;19(12):1033-1042. doi: 10.1016/j.neo.2017.09.005. Epub 2017 Nov 14. Neoplasia. 2017. PMID: 29149667 Free PMC article.
-
Impact of the acidic environment on gene expression and functional parameters of tumors in vitro and in vivo.J Exp Clin Cancer Res. 2021 Jan 6;40(1):10. doi: 10.1186/s13046-020-01815-4. J Exp Clin Cancer Res. 2021. PMID: 33407762 Free PMC article.
References
-
- Bausell RB, Li Y-F (Eds) (2002) ‘Power Analysis for Experimental Research. A Practical Guide of the Biological, Medical and Social Sciences’, pp. 4, 56 Cambridge, UK: Cambridge University Press
-
- Biaglow JE, Manevich Y, Leeper D, Chance B, Dewhirst MW, Jenkins WT, Tuttle SW, Wroblewski K, Glickson JD, Stevens C, Evans SM (1998) MIBG inhibits respiration: potential for radio- and hyperthermic sensitization. Int J Radiat Oncol Biol Phys 42: 871–876 - PubMed
-
- Blouw B, Song H, Tihan T, Bosze J, Ferrara N, Gerber HP, Johnson RS, Bergers G (2003) The hypoxic response of tumors is dependent on their microenvironment. Cancer Cell 4: 133–146 - PubMed
-
- Bristow RG, Hardy PA, Hill RP (1990) Comparison between in vitro radiosensitivity and in vivo radioresponse of murine tumor cell lines. I: parameters of in vitro radiosensitivity and endogenous cellular glutathione levels. Int J Radiat Oncol Biol Phys 18: 133–145 - PubMed
-
- Brizel DM, Rosner GL, Harrelson J, Prosnitz LR, Dewhirst MW (1994) Pretreatment oxygenation profiles of human soft tissue sarcomas. Int J Radiat Oncol Biol Phys 30: 635–642 - PubMed
Publication types
MeSH terms
Substances
LinkOut - more resources
Full Text Sources
