. 2004 May 19;24(20):4840-8.
doi: 10.1523/JNEUROSCI.0845-04.2004.

Acceleration of visual system development by environmental enrichment

Affiliations

Acceleration of visual system development by environmental enrichment

Laura Cancedda et al. J Neurosci. .

Abstract

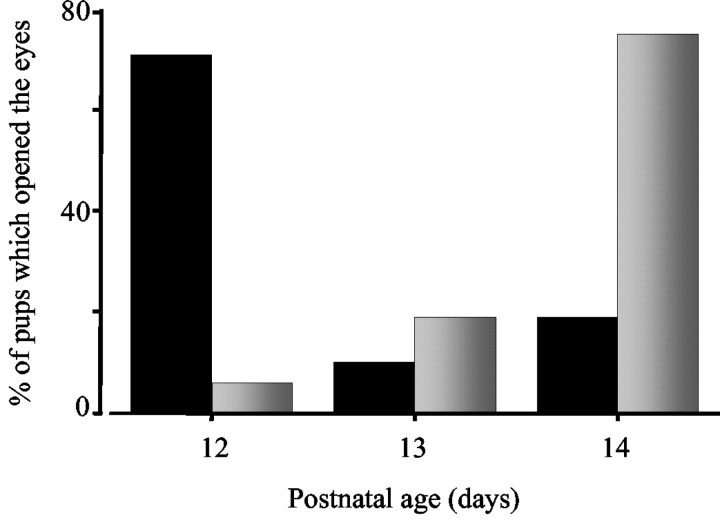
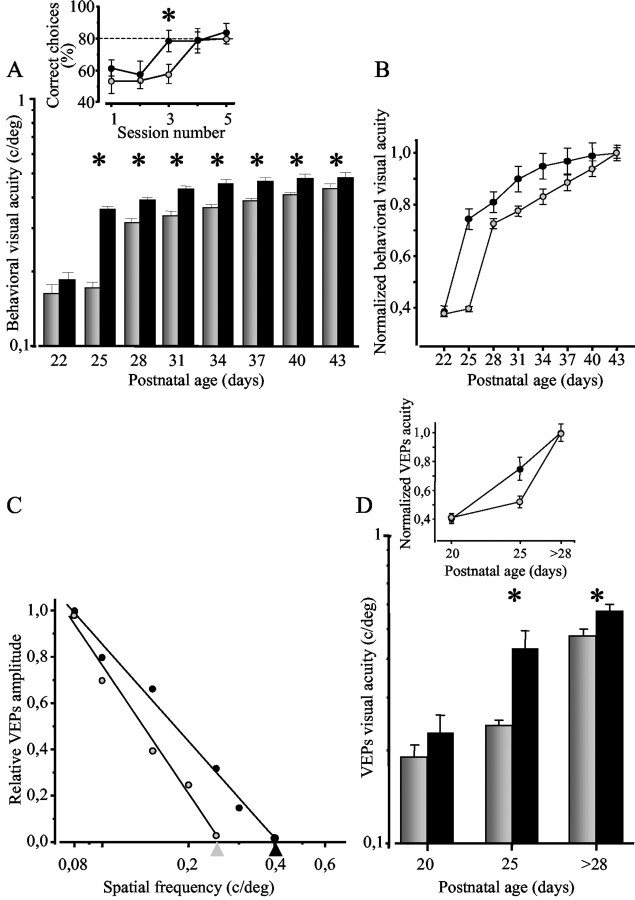
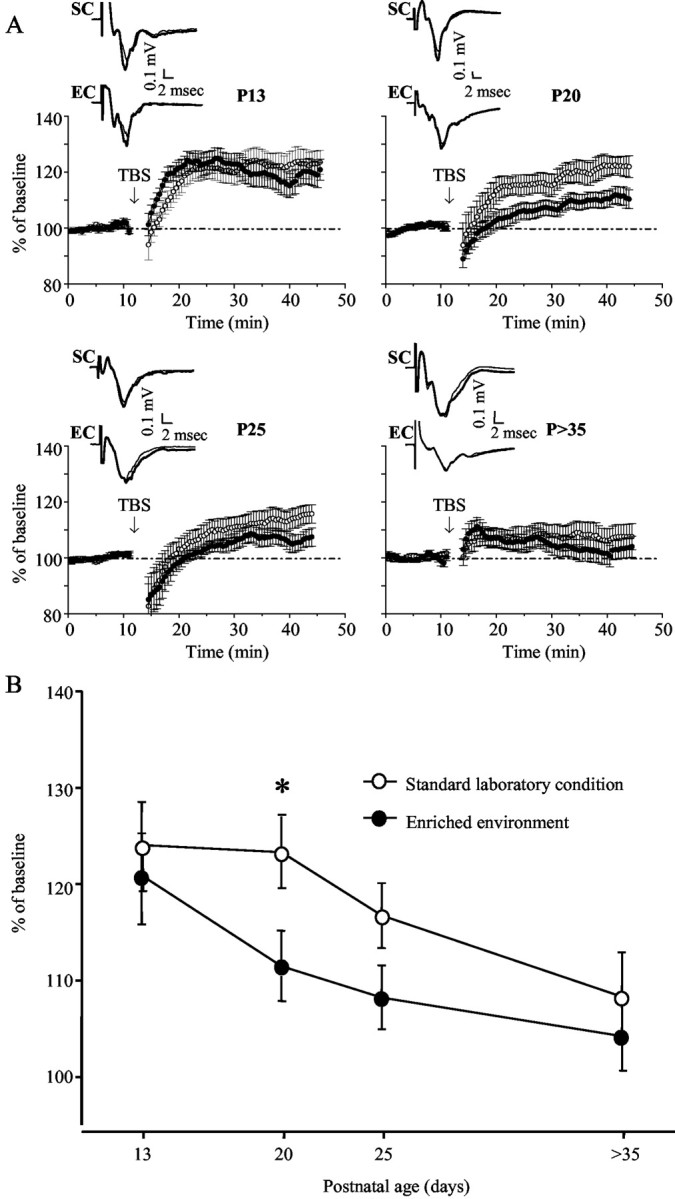
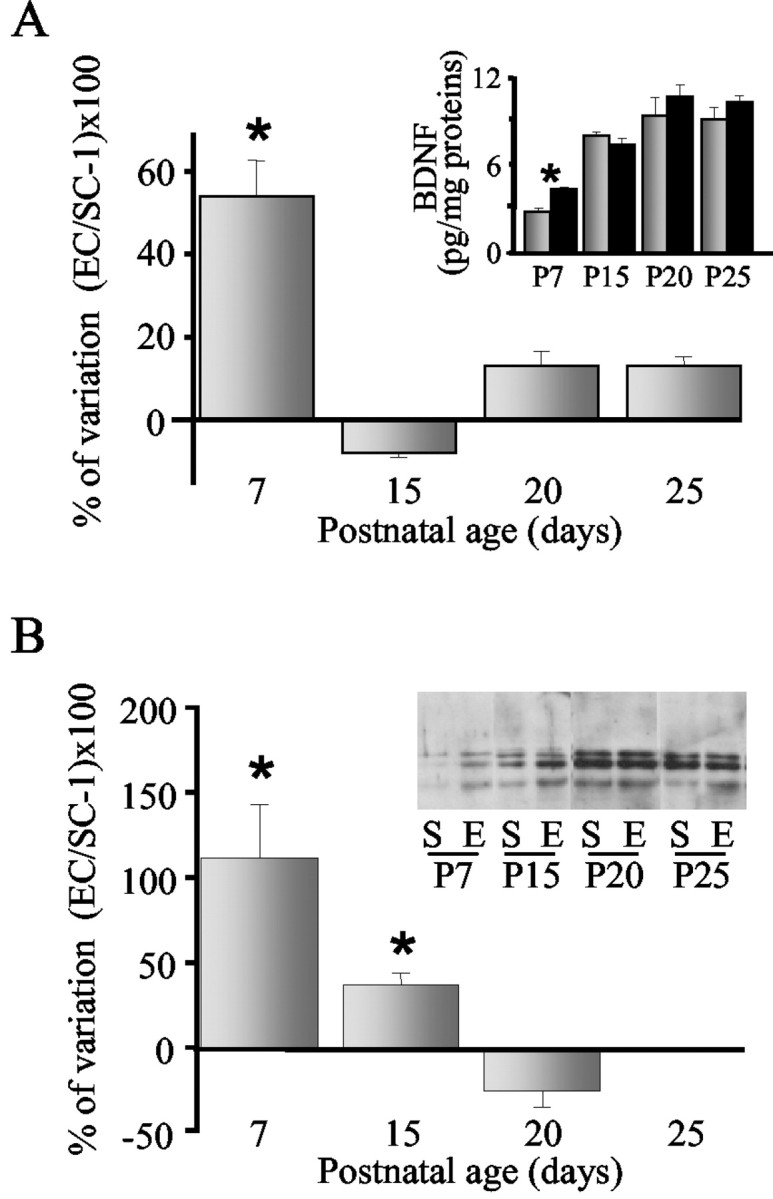
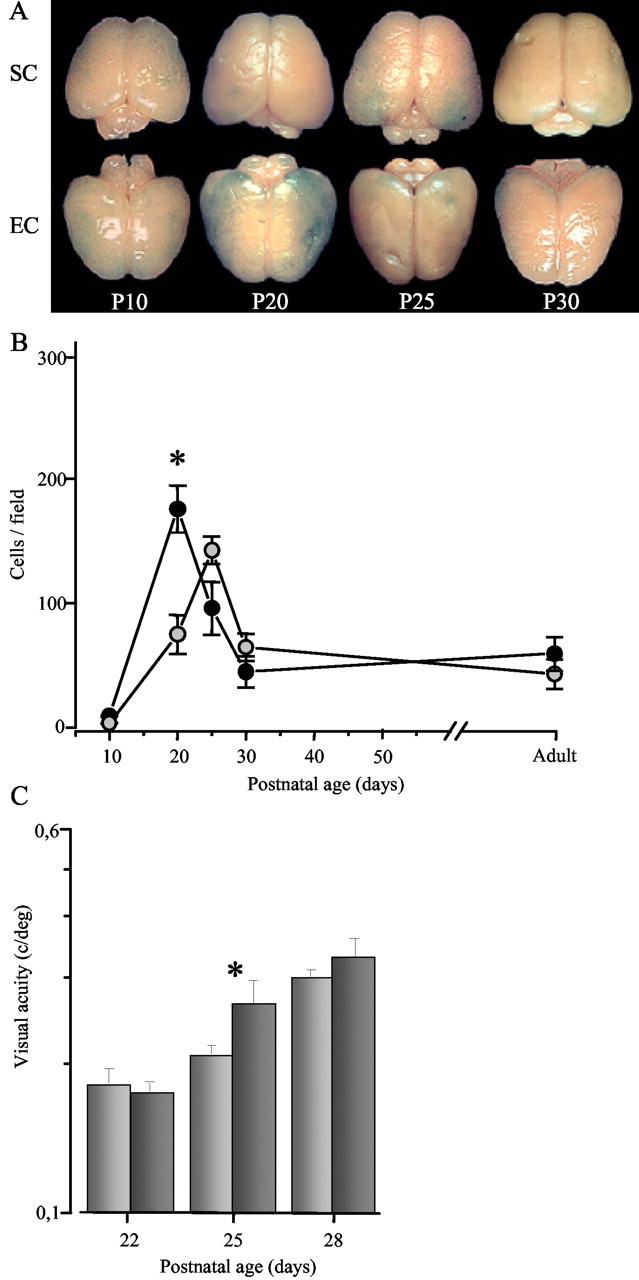
Thus far, the developmental plasticity of the visual system has been studied by altering or reducing visual experience. Here, we investigated whether a complex sensory-motor stimulation, provided by rearing animals in an enriched environment, affects visual system development. We found that raising mice in this condition causes an earlier eye opening, a precocious development of visual acuity, and an accelerated decline of white matter-induced long-term potentiation. These effects are accompanied by a precocious cAMP response element-mediated gene expression and a significant increase of BDNF protein and GAD65/67 expression in enriched pups. In addition, we showed that enriched pups experienced higher levels of licking behavior provided by adult females. Thus, rearing mice from birth in an enriched environment leads to a conspicuous acceleration of visual system development as ascertained at behavioral, electrophysiological, and molecular level.


Figures

Figure 1.
Figure 1.
Precocious eye opening in environmentally enriched mice. Percentage of EC (black) and SC (gray) pups that opened their eyes at the indicated ages is shown. There was a precocious eye opening by ∼2 d (Mann–Whitney rank sum test; p < 0.001) in EC with respect to SC mice.
Figure 2.
Figure 2.
A, Inset, Percentage of correct responses during the training sessions (10 trials in each session) of the visual water task in EC (black) and SC (gray) reared mice. The behavior of the two experimental groups is different at the third session; EC animals have learned the task (80% of correct choices; Kruskal–Wallis one-way ANOVA on ranks; p < 0.001; post hoc Tukey test; p < 0.05). The bars indicate SEM. The asterisk indicates that the groups are statistically different. A, Behavioral assessment of visual acuity in SC (gray) and EC (black) groups at different ages. Visual acuity of animals is plotted as groups of age. Two-way ANOVA shows a significant effect of age and environmental housing condition (p < 0.001) and a significant interaction between age and environmental housing condition (p < 0.001). Post hoc Tukey test reveals a significant difference (*) at any age starting from P25 between EC and SC groups (p < 0.05). The bars indicate SEM. B, Normalized behavioral visual acuity; note that the two developmental curves are clearly shifted along the time axis. C, Examples of visual acuity estimates in an EC and SC mouse at P25. Visual acuity (arrow) was determined by extrapolating VEP amplitude to 0. D, Electrophysiological assessment of visual acuity in SC (gray) and EC (black) mice during postnatal development. Visual acuity of animals is plotted as groups of age. Two-way ANOVA shows a significant effect of age and environmental housing condition (p < 0.001) and a significant interaction between age and environmental housing condition (p < 0.05). Post hoc Tukey test reveals a significant difference (*) at any age starting from P25 between EC and SC groups (p < 0.05). The bars indicate SEM. D, Inset, Normalized electrophysiological visual acuity at the indicated ages.
Figure 3.
Figure 3.
Accelerated developmental decline of WM-LTP in enriched mice. A, Average time course of the changes in layer III field synaptic potential amplitude after TBS of the WM in EC (black) and SC (white) mice at different postnatal ages (P13; p > 35). The bars indicate SEM. Averages of 10 consecutive traces recorded at different postnatal ages from EC and SC mice before (thin line) and 30 min after (thick line) TBS are also reported on the top of the time course for each age. B, Postnatal age-dependent changes in the magnitude of WM-LTP measured 30 min after TBS. Three-way ANOVA shows that, although the time course of the field potential amplitude is the same in all conditions (F(12) = 0.37; p = 0.9), the level of potentiation is significantly different at different ages and for the two different groups (F(13) = 2.67, p < 0.001, and F(11) = 29.91, p < 0.001, respectively). Moreover, the three-way ANOVA shows a significant interaction between the postnatal age and the environmental housing (F(13, 11) = 3.79; p = 0.01), with the EC group being significantly different from the SC group at P20 (post hoc LSD test; p < 0.05). The bars indicate SEM.
Figure 4.
Figure 4.
Higher levels of BDNF protein and GAD 65/67 expression in environmentally enriched pups. A, Percentage of variation of BDNF content in EC and SC occipital cortices computed as [(EC/SC) – 1] × 100 at different ages. The asterisk indicates that the BDNF levels in EC and SC groups are different (t test; p < 0.001). Bars indicate SEM. A, Inset, Developmental increase of total protein levels of endogenous BDNF in occipital cortices of EC (black) and SC (gray) mice. B, Percentage of variation of GAD 65/67 expression in EC and SC occipital cortices computed as [(EC/SC) – 1] × 100 at different ages. The asterisk indicates that the GAD 65/67 expression in EC and SC groups is different (t test; p < 0.001). Bars indicate SEM. B, Inset, Representative gel of Western blot for GAD 65/67 expression at different ages in occipital cortices of SC and EC mice.
Figure 5.
Figure 5.
Involvement of cAMP/CREB system in the development of mice visual cortex. A, Precocious massive CRE-mediated gene expression in enriched mice. Brains of CRE-LacZ mice reared in SC and in EC at different ages (P10–P30) are shown. B, Quantification of the density of X-gal-positive cells (1 mm2 field) for the SC (gray) and EC (black) animals at the indicated ages. Fields were chosen to sample layers II-VI of the binocular visual cortex. The circles represent average density ± SEM. Two-way ANOVA reveals no significant effect of environmental housing conditions (p = 0.389) but a significant effect of age (p < 0.001) and a significant interaction between age and environmental housing conditions (p < 0.001). Post hoc Tukey test showed a significant difference at P20 between EC and SC groups (p < 0.05). The asterisk indicates that the groups are statistically different. C, Activating the cAMP/CREB system with rolipram partially mimics the enriched environment effects on mice visual acuity development. Behavioral assessment of visual acuity in animals treated with the inhibitor of the phosphodiesterase type IV rolipram (dark gray) and vehicle (light gray) at different ages is shown. Visual acuity of animals is plotted as groups of age. Visual acuity of rolipram-treated animals is significantly different (*) from vehicle-treated mice at P25 (Kruskal–Wallis one-way ANOVA on ranks, p < 0.001; post hoc Student–Newman–Keuls test, p < 0.05). The bars indicate SEM.

Similar articles

Cited by

References

    1. Barnett SA, Burn J (1967) Early stimulation and maternal behaviour. Nature 213: 150–152. - PubMed
    1. Barth AL, McKenna M, Glazewski S, Hill P, Impey S, Storm D, Fox K (2000) Upregulation of cAMP response element-mediated gene expression during experience-dependent plasticity in adult neocortex. J Neurosci 20: 4206–4216. - PMC - PubMed
    1. Bartoletti A, Medini P, Berardi N, Maffei L (2004) Environmental enrichment prevents effects of dark-rearing in the rat visual cortex. Nat Neurosci 7: 215–216. - PubMed
    1. Bear MF, Kleinschmidt A, Gu QA, Singer W (1990) Disruption of experience-dependent synaptic modifications in striate cortex by infusion of an NMDA receptor antagonist. J Neurosci 10: 909–925. - PMC - PubMed
    1. Cancedda L, Putignano E, Impey S, Maffei L, Ratto GM, Pizzorusso T (2003) Patterned vision causes CRE-mediated gene expression in the visual cortex through PKA and ERK. J Neurosci 23: 7012–7020. - PMC - PubMed

Publication types

MeSH terms

Substances

LinkOut - more resources