. 2004 Mar;5(1):9-22.
doi: 10.1093/bib/5.1.9.

Saccharomyces genome database: underlying principles and organisation

Affiliations

Saccharomyces genome database: underlying principles and organisation

Selina S Dwight et al. Brief Bioinform. 2004 Mar.

Abstract

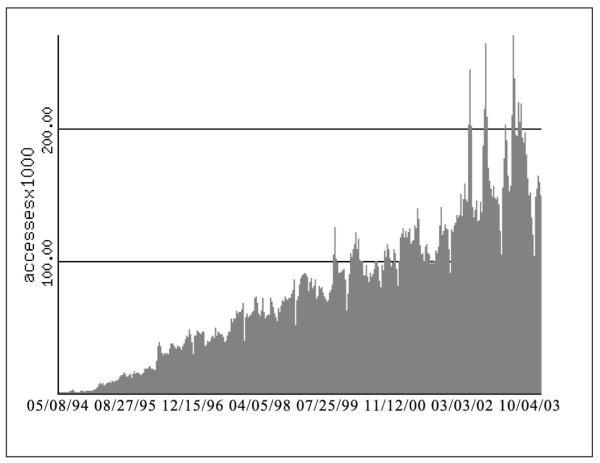
A scientific database can be a powerful tool for biologists in an era where large-scale genomic analysis, combined with smaller-scale scientific results, provides new insights into the roles of genes and their products in the cell. However, the collection and assimilation of data is, in itself, not enough to make a database useful. The data must be incorporated into the database and presented to the user in an intuitive and biologically significant manner. Most importantly, this presentation must be driven by the user's point of view; that is, from a biological perspective. The success of a scientific database can therefore be measured by the response of its users - statistically, by usage numbers and, in a less quantifiable way, by its relationship with the community it serves and its ability to serve as a model for similar projects. Since its inception ten years ago, the Saccharomyces Genome Database (SGD) has seen a dramatic increase in its usage, has developed and maintained a positive working relationship with the yeast research community, and has served as a template for at least one other database. The success of SGD, as measured by these criteria, is due in large part to philosophies that have guided its mission and organisation since it was established in 1993. This paper aims to detail these philosophies and how they shape the organisation and presentation of the database.


Figures

Figure 1
Figure 1
Usage of the Saccharomyces Genome Database website has increased steadily since its inception. This diagram covers the period from 8th May, 1994, to 4th October, 2003, and shows the number of requests per week for HTML pages, including those generated by cgi scripts accessing the database for information specific to a given gene. Image maps, redirections, requests from any computer in the Stanford.EDU domain, and personal WWW pages are not included in the usage statistics. Certain hosts have been excluded because they have indexed our site. The most up-to-date version of this graph is available online
Figure 2
Figure 2
This pie chart breaks down requests during the week of 28th September, 2003, to 4th October, 2003, for HTML pages by document accessed, including those generated by cgi scripts accessing the database for information specific to a given gene. As is typical, requests for Locus pages make up nearly 30 per cent of all hits while requests for the home page itself make up about 10 per cent. The relative popularity of other tools varies from week to week. The individual slices in this pie chart show a representative sample of SGD’s most popular tools: 1. Locus pages (27.9 per cent), 2. Home page (10.5 per cent), 3. BLAST (7.0 per cent), 4. Sequence Retrieval (6.5 per cent), 5. ORF Map (6.0 per cent), 6. Gene/Sequence Resources (5.5 per cent), 7. Quick Search (4.4 per cent), 8. GO term pages (2.8 per cent), 9. Literature Guide (2.1 per cent), Other tools and pages (27.3 per cent). Access to weekly reports of SGD usage statistics is available via the main Saccharomyces Genome Database Usage Statistics page
Figure 3
Figure 3
The SGD Homology and Comparisons page is found by clicking on ‘Homology & Comparisons’ located in the left-hand column on SGD’s Home page. The left-hand column of the Homology & Comparisons contents page, like other SGD contents pages and the SGD home page, provides a consistent navigation menu to move between the main categories of information to view the tools and resources available within each category. The main portion of the Homology & Comparisons index page lists all of the various tools and resources available within this category of information. At the top of the page, as on the Locus page (Figure 4), is the standard header and tool bar that appears on most SGD pages, providing easy and consistent navigation throughout the website
Figure 4
Figure 4
The SGD Locus Page (the bottom of the page shown here is truncated for space considerations) is the central point for information about any gene in SGD. The left-hand column provides basic information about the specific gene, BNA1 in this example, including nomenclature (standard name, alias and systematic name), feature type, Gene Ontology (GO) annotations, biochemical pathways (where relevant), the sequence coordinates where the gene is located, and other basic information. The right-hand column contains a series of pull-down menus with links to related information and resources for this gene, including relevant literature, sequence analysis, protein information, localisation information, interactions and other resources. The help icon in the upper right corner links to a help page written specifically to explain the various features of the Locus Page and its organisation. A standard header and tool bar, which appears on most SGD pages, is found at the top of the page (also seen in Figure 3). At the top of the SGD Locus Page is the standard header and tool bar that appears on most SGD pages to provide consistent navigation to important tools from any location within SGD. The Quick Search box allows users to access the basic search for information in SGD from any page. The upper menu bar provides links to key help and search pages as well as a consistent link back to the home page. The lower menu bar provides links to some of SGD’s most popular tools, as determined by our usage statistics
Figure 5
Figure 5
(a) The Genomic View is a graphic display of all 16 chromosomes of S. cerevisiae. The horizontal bars represent the individual chromosomes. The length of each bar indicates the relative length of each chromosome, and the black dots denote the locations of centromeres. Each chromosome is also labelled with selected mapped genes to serve as positional markers. A variety of more detailed maps, such as the Chromosomal Features Map (b), can be accessed selecting a map type and clicking on a segment of a chromosome. (b) Chromosomal Features Map is a graphic display of the genetic features located on a specified region of a chromosome. The large horizontal bar at the top of the figure represents the chromosome, with the position of the centromere indicated with a black dot and the chromosomal coordinates indicated by the −103× scale bar, above. The position of the detailed section, displayed below, is indicated by a rectangle on the chromosome. Clicking and dragging this rectangle can be used to expand, narrow or move the view. The parallel lines indicate the two different complementary strands of DNA, and features encoded on either strand are labelled with rectangular boxes. Labelled features include centromeres, tRNAs, RNA genes, Ty transposons, TY LTR elements, rRNAs and snRNAs, with feature type indicated by colour (key not included on this figure)

References

    1. SGD (Saccharomyces Genome Database) Stanford University; URL: http://www.yeastgenome.org [cited 9th October, 2003]
    1. ACEDB Documentation . The Wellcome Trust Sanger Institute; URL: http://www.acedb.org/Documentation/[cited 9th October, 2003]
    1. SGD Usage Statistics . Stanford University; URL: http://genome-www.stanford.edu/usage/sgd/[cited 9th October, 2003]
    1. DictyBase URL: http://dictybase.org [cited 9th October, 2003]
    1. SGD ftp site . Stanford University; URL: ftp://genome-ftp.stanford.edu/pub/yeast/[cited 9th October, 2003]