

CD8+ T lymphocyte responses target functionally important regions of Protease and Integrase in HIV-1 infected subjects
- PMID: 15154967
- PMCID: PMC441415
- DOI: 10.1186/1479-5876-2-15
CD8+ T lymphocyte responses target functionally important regions of Protease and Integrase in HIV-1 infected subjects
Abstract
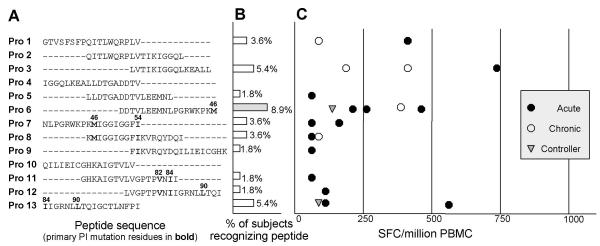
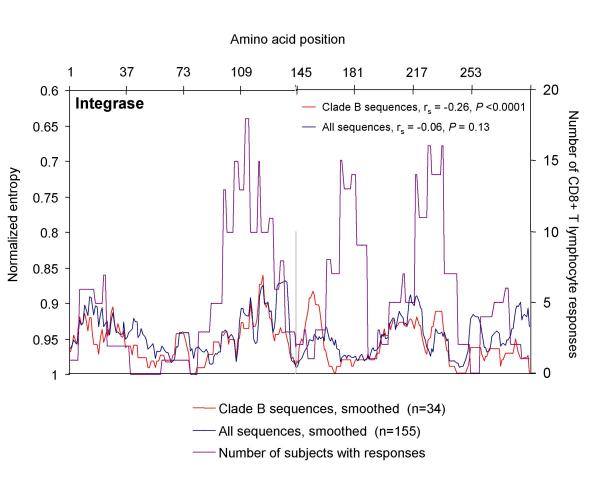
BACKGROUND: CD8+ T cell responses are known to be important to the control of HIV-1 infection. While responses to reverse transcriptase and most structural and accessory proteins have been extensively studied, CD8 T cell responses specifically directed to the HIV-1 enzymes Protease and Integrase have not been well characterized, and few epitopes have been described in detail. METHODS: We assessed comprehensively the CD8 T cell responses to synthetic peptides spanning Protease and Integrase in 56 HIV-1 infected subjects with acute, chronic, or controlled infection using IFN-gamma-Elispot assays and intracellular cytokine staining. Fine-characterization of novel CTL epitopes was performed on peptide-specific CTL lines in Elispot and 51Chromium-release assays. RESULTS: Thirteen (23%) and 38 (68%) of the 56 subjects had detectable responses to Protease and Integrase, respectively, and together these targeted most regions within both proteins. Sequence variability analysis confirmed that responses cluster largely around conserved regions of Integrase, but responses against a large, highly conserved region of the N-terminal DNA-binding domain of Integrase were not readily detected. CD8 T cell responses targeted regions of Protease that contain known Protease inhibitor mutation residues, but strong Protease-specific CD8 T cell responses were rare. Fine-mapping of targeted epitopes allowed the identification of three novel, HLA class I-restricted, frequently-targeted optimal epitopes. There were no significant correlations between CD8 T cell responses to Protease and Integrase and clinical disease category in the study subjects, nor was there a correlation with viral load. CONCLUSIONS: These findings confirm that CD8 T cell responses directed against HIV-1 include potentially important functional regions of Protease and Integrase, and that pharmacologic targeting of these enzymes will place them under both drug and immune selection pressure.
Figures
 ): controllers.
 ): controllers.


Similar articles
-
Cytotoxic T-lymphocyte (CTL) responses directed against regulatory and accessory proteins in HIV-1 infection.DNA Cell Biol. 2002 Sep;21(9):671-8. doi: 10.1089/104454902760330219. DNA Cell Biol. 2002. PMID: 12396610
-
Cytotoxic T-cell responses to HIV-1 reverse transcriptase, integrase and protease.AIDS. 1998 Aug 20;12(12):1427-36. doi: 10.1097/00002030-199812000-00004. AIDS. 1998. PMID: 9727563
-
Limited sequence evolution within persistently targeted CD8 epitopes in chronic human immunodeficiency virus type 1 infection.J Virol. 2005 Jul;79(13):8171-81. doi: 10.1128/JVI.79.13.8171-8181.2005. J Virol. 2005. PMID: 15956562 Free PMC article.
-
Induction of a primary human cytotoxic T-lymphocyte response against a novel conserved epitope in a functional sequence of HIV-1 reverse transcriptase.AIDS. 1995 Feb;9(2):121-7. AIDS. 1995. PMID: 7536421
-
CD8 T-cell responses in early HIV-1 infection are skewed towards high entropy peptides.AIDS. 2005 Feb 18;19(3):241-50. AIDS. 2005. PMID: 15718834
Cited by
-
Uneven genetic robustness of HIV-1 integrase.J Virol. 2015 Jan;89(1):552-67. doi: 10.1128/JVI.02451-14. Epub 2014 Oct 22. J Virol. 2015. PMID: 25339768 Free PMC article.
-
Neuropathogenic SIVsmmFGb genetic diversity and selection-induced tissue-specific compartmentalization during chronic infection and temporal evolution of viral genes in lymphoid tissues and regions of the central nervous system.AIDS Res Hum Retroviruses. 2010 Jun;26(6):663-79. doi: 10.1089/aid.2009.0168. AIDS Res Hum Retroviruses. 2010. PMID: 20518690 Free PMC article.
-
Epitope shifting of gp90-specific cellular immune responses in EIAV-infected ponies.Vet Immunol Immunopathol. 2014 Oct 15;161(3-4):161-9. doi: 10.1016/j.vetimm.2014.08.001. Epub 2014 Aug 10. Vet Immunol Immunopathol. 2014. PMID: 25176006 Free PMC article.
-
Consensus HIV-1 FSU-A integrase gene variants electroporated into mice induce polyfunctional antigen-specific CD4+ and CD8+ T cells.PLoS One. 2013 May 8;8(5):e62720. doi: 10.1371/journal.pone.0062720. Print 2013. PLoS One. 2013. PMID: 23667513 Free PMC article.
-
Dual selection pressure by drugs and HLA class I-restricted immune responses on human immunodeficiency virus type 1 protease.J Virol. 2007 Mar;81(6):2887-98. doi: 10.1128/JVI.01547-06. Epub 2007 Jan 3. J Virol. 2007. PMID: 17202219 Free PMC article.
References
-
- Finzi D, Blankson J, Siliciano JD, Margolick JB, Chadwick K, Pierson T, Smith K, Lisziewicz J, Lori F, Flexner C, Quinn TC, Chaisson RE, Rosenberg E, Walker B, Gange S, Gallant J, Siliciano RF. Latent infection of CD4+ T cells provides a mechanism for lifelong persistence of HIV-1, even in patients on effective combination therapy. Nat Med. 1999;5:512–517. doi: 10.1038/8394. - DOI - PubMed
-
- Jin X, Bauer DE, Tuttleton SE, Lewin S, Gettie A, Blanchard J, Irwin CE, Safrit JT, Mittler J, Weinberger L, Kostrikis LG, Zhang L, Perelson AS, Ho DD. Dramatic rise in plasma viremia after CD8(+) T cell depletion in simian immunodeficiency virus-infected macaques. J Exp Med. 1999;189:991–998. doi: 10.1084/jem.189.6.991. - DOI - PMC - PubMed
-
- Schmitz JE, Kuroda MJ, Santra S, Sasseville VG, Simon MA, Lifton MA, Racz P, Tenner-Racz K, Dalesandro M, Scallon BJ, Ghrayeb J, Forman MA, Montefiori DC, Rieber EP, Letvin NL, Reimann KA. Control of viremia in simian immunodeficiency virus infection by CD8+ lymphocytes. Science. 1999;283:857–860. doi: 10.1126/science.283.5403.857. - DOI - PubMed
Grants and funding
LinkOut - more resources
Full Text Sources
Research Materials
