Review
. 2004 Aug 1;558(Pt 3):717-28.
doi: 10.1113/jphysiol.2004.065771. Epub 2004 May 21.

Mapping receptive fields in primary visual cortex

Affiliations
Review

Mapping receptive fields in primary visual cortex

Dario L Ringach. J Physiol. .

Abstract

Nearly 40 years ago, in the pages of this journal, Hubel and Wiesel provided the first description of receptive fields in the primary visual cortex of higher mammals. They defined two classes of cortical cells, "simple" and "complex", based on neural responses to simple visual stimuli. The notion of a hierarchy of receptive fields, where increasingly intricate receptive fields are constructed from more elementary ones, was introduced. Since those early days we have witnessed the birth of quantitative methods to map receptive fields and mathematical descriptions of simple and complex cell function. Insights gained from these models, along with new theoretical concepts, are refining our understanding of receptive field structure and the underlying cortical circuitry. Here, I provide a brief historical account of the evolution of receptive field mapping in visual cortex along with the associated conceptual advancements, and speculate on the shape novel theories of the cortex may take as a result these measurements.


Figures

Figure 1
Figure 1. The classical hierarchical model of simple and complex cells
A, simple cells have segregated ‘on’ and ‘off’ subregions (examples A and B are geniculate (receptive fields). B and C, classical model of simple and complex receptive fields. B elongated ‘on–off’ subregions in simple cells were proposed to be constructed by the convergence of geniculate receptive fields aligned in space. C, complex cells are in turn constructed by the convergence of simple cells.
Figure 2
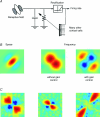
Figure 2. Reverse correlation measurements of simple-cell receptive fields in cat and monkey V1
A and B, schematic diagram of the apparatus used by Erich Sutter to measure, for the first time, the full spatio-temporal receptive field of simple cells in cat area 17 (see text for details). C, two examples of simple-cell receptive fields measurements from Jones & Palmer (1987b). D, analysis of the distribution of receptive field shapes in macaque and cat primary visual cortex. The parameter nxrepresents the width of the receptive field relative to the period of the underlying grating in a Gabor fit. This number is proportional to the effective number of subregions in the receptive field. Similarly, ny represents the length (elongation) of the receptive field relative to the period of the underlying grating. Open circles are data from macaque V1, crosses are from cat area 17 (Figure 2C reproduced with permission from the American Physiology Society; Jones & Palmer, 1987a).
Figure 3
Figure 3. Gain control and sharpening of tuning
A, the gain control model of simple cells. The gain of the front-end filter is divided by the summed activity of a ‘normalization pool’ (Carandini et al. 1997; copyright 1997 by the Society for Neuroscience). B, gain control can sharpen tuning in the Fourier domain. The panel on the left shows a simulated Gabor-like receptive field in space. The two panels on the right illustrate the tuning of the neurone in the Fourier (frequency) domain (with the origin at the centre of the panel). The result of gain control is to ‘carve away’ the activity near the origin resulting in a more localized region that produces response enhancement. The gain control signal is untuned for orientation and low-pass in spatial frequency, nevertheless, it can sharpen tuning. C, tuning in the Fourier domain for three sample cells in macaque V1 (Ringach et al. 2002). The two examples on the left are consistent with a gain control signal untuned for orientation, but the one on the right shows maximal (net) suppression at oblique angles, implying a tuned suppressive signal (see also Shapley et al. 2003 for a review).
Figure 4
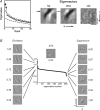
Figure 4. The spike-triggered covariance method
A, results from a complex cell in cat area 17. Only two eigenvalues (excitatory) are significant and the associated eigenvectors (right) show orientated structure in space–time (Touryan et al. 2002; copyright 2002 by the Society for Neuroscience). B, results from a directional complex cells in monkey V1 (reprinted from Rust et al. 2004, copyright 2004, with permission from Elsevier). Both excitatory and inhibitory subspaces can be identified. Eigenvectors within each subspace have a similar orientation in space–time but they have opposite preferences of motion.

References

    1. Abbott LF, Chance FS. Rethinking the taxonomy of visual neurons. Nat Neurosci. 2002;5:391–392. - PubMed
    1. Adelson EH, Bergen JR. Spatiotemporal energy models for the perception of motion. J Opt Soc Am A. 1985;2:284–299. - PubMed
    1. Albrecht DG, Geisler WS. Motion selectivity and the contrast-response function of simple cells in the visual cortex. Vis Neurosci. 1991;7:825–837. - PubMed
    1. Albrecht DG, Geisler WS, Crane AM. Nonlinear properties of visual cortex neurons: Temporal dynamics, stimulus selectivity, neural performance. In: Chalupa L, Werner J, editors. The Visual Neurosciences. Boston: MIT Press; 2003. pp. 825–837.
    1. Anzai A, Ohzawa I, Freeman RD. Neural mechanisms for processing binocular information I. Simple cells. J Neurophysiol. 1999;82:891–908. - PubMed

LinkOut - more resources