. 2004 Jun 1;101(22):8384-9.
doi: 10.1073/pnas.0402140101. Epub 2004 May 21.

Molecular diversity of astrocytes with implications for neurological disorders

Affiliations

Molecular diversity of astrocytes with implications for neurological disorders

Robert M Bachoo et al. Proc Natl Acad Sci U S A. .

Abstract

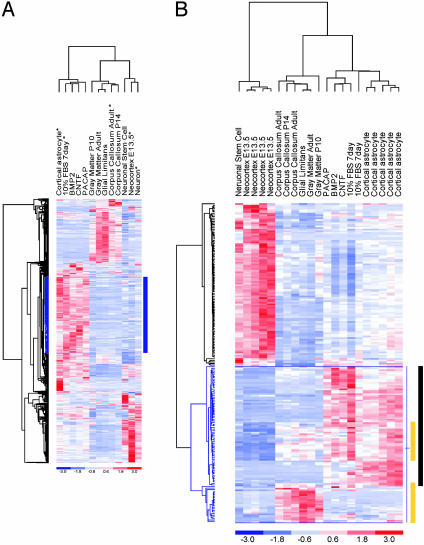
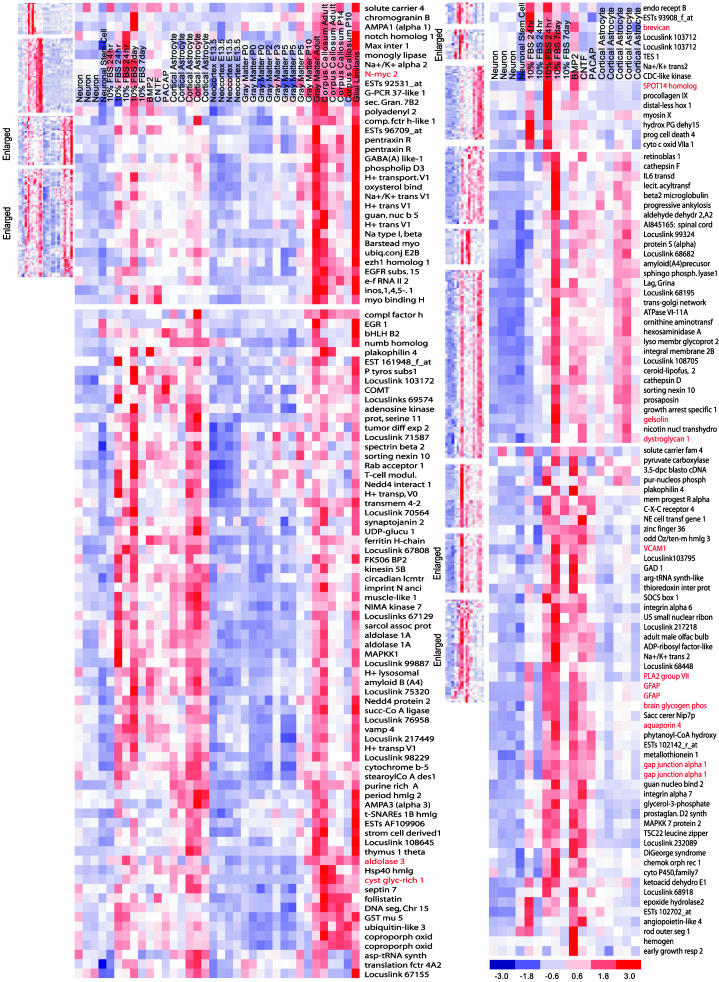
The astrocyte represents the most abundant yet least understood cell type of the CNS. Here, we use a stringent experimental strategy to molecularly define the astrocyte lineage by integrating microarray datasets across several in vitro model systems of astrocyte differentiation, primary astrocyte cultures, and various astrocyterich CNS structures. The intersection of astrocyte data sets, coupled with the application of nonastrocytic exclusion filters, yielded many astrocyte-specific genes possessing strikingly varied patterns of regional CNS expression. Annotation of these astrocyte-specific genes provides direct molecular documentation of the diverse physiological roles of the astrocyte lineage. This global perspective in the normal brain also provides a framework for how astrocytes may participate in the pathogenesis of common neurological disorders like Alzheimer's disease, Parkinson's disease, stroke, epilepsy, and primary brain tumors.


Figures

Fig. 1.
Fig. 1.
Identification of astrocyte candidate genes by UHC and R-SVM. (A) UHC analysis divides the experimental samples into two distinct groups that cluster on separate branches of the dendrogram. All of the astrocyte samples are together. The short vertical distance between the astrocyte samples in the dendrogram indicates statistical similarity between the cortical astrocyte samples and the various differentiated astrocytes. Similarly, the CC, WM, and GL cluster together, suggesting a common transcriptional signal. The NSC, the E13.5 cortex, and neuronal-lineage-committed cells cluster together. The expression level matrix is shown representing standardized values from -3 (blue, below the mean) to 3 (red, above the mean). The mean (0 value) is white. Rows correspond to different genes and the columns represent the various experimental samples. When we use all in vitro and in vivo experimental samples, UHC generates a large cluster of 393 genes (outlined in blue), which are strongly expressed among the in vitro astrocyte samples (indicated by blue bar). Although GFAP is among this group of astrocyte-associated genes, there is no obvious GFAP subcluster. (B) R-SVM, a class prediction tool, identified a subset of 85 genes, which contribute most to distinguishing astrocytes from undifferentiated or early lineage-committed cells. A majority (53%) of the astrocyte candidate genes were from only in vitro astrocyte experimental samples (indicated by black bar), and the remainder were differentially expressed both in cultured astrocytes and among the brain subregions (yellow bars). Regions of overlap indicate genes, which were differentially expressed in both experimental samples.
Fig. 2.
Fig. 2.
Astrocytic candidate gene validation. (A) Candidate astrocyte genes with glial expression based on similarity to the reference gene expression patterns for GFAP ISH and/or GFAP immunohistochemistry were chosen for further validation. Note the marked abundance of GFAP RNA in GL and CC (arrowheads) and relative absence in cortical GM (cx). (B) The majority of validated genes showed a broad “pan-astrocytic” pattern of expression in GM and WM astrocytes [shown here are: Clusterin (Clu), ApoE, GST (GSTm), Aldolase 3 (Aldo3), and Cystatin 3 (Cst3)]; a subset of each which were GFAP-positive. (C) Several validated astrocyte genes showed a restricted expression pattern in subsets of astrocytes. Phospholipase A, group7 (Pla2g7) was predominantly expressed in cortical GM astrocytes, whereas Aquaporin 4 (Aqp4) was highly abundant in GL regions.
Fig. 3.
Fig. 3.
Tight-cluster analysis and validated astrocyte-specific genes identify additional astrocyte candidate genes. (A) Tight-cluster analysis identified four tight clusters (reduced, shown in descending order of tightness, Left Upper) by inclusion of a total of six validated astrocyte genes across both astrocytes in cell culture and among the brain subregions but not in NSCs, neurons, or embryonic brain. Two of these tight clusters are enlarged and shown with gene names, (top and bottom clusters have 28 and 51 genes, respectively). Validated genes are red, the top cluster shows one gene, and the bottom cluster shows three genes. (B) Similar tight-cluster analysis by using only the cell culture samples yield nine clusters (shown on the left in descending order of tightness) identified by 16 in situ-validated genes, the three enlarged clusters, with a total of 12, 26, and 40 genes, have two, two, and six validated astrocyte genes, respectively.

References

    1. Shirasaki, R. & Pfaff, S. L. (2002) Annu. Rev. Neurosci. 25, 251-281. - PubMed
    1. Miller, R. H. (2002) Prog. Neurobiol. 67, 451-467. - PubMed
    1. Steindler, D. A. & Laywell, E. D. (2003) Glia 43, 62-69. - PubMed
    1. Doetsch, F. (2003) Nat. Neurosci. 6, 1127-1134. - PubMed
    1. Fields, R. D. & Stevens-Graham, B. (2002) Science 298, 556-562. - PMC - PubMed

Publication types