. 2004 Jun 1;43(21):6447-63.
doi: 10.1021/bi0496945.

Crystal structure of Escherichia coli cytidine triphosphate synthetase, a nucleotide-regulated glutamine amidotransferase/ATP-dependent amidoligase fusion protein and homologue of anticancer and antiparasitic drug targets

Affiliations

Crystal structure of Escherichia coli cytidine triphosphate synthetase, a nucleotide-regulated glutamine amidotransferase/ATP-dependent amidoligase fusion protein and homologue of anticancer and antiparasitic drug targets

James A Endrizzi et al. Biochemistry. .

Abstract

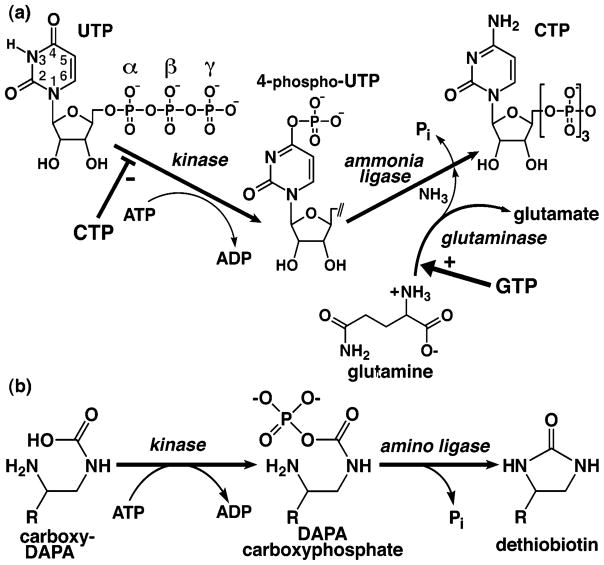
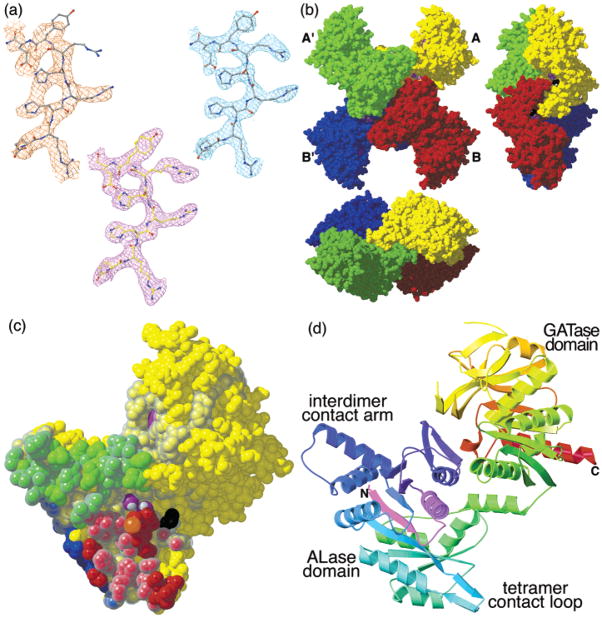
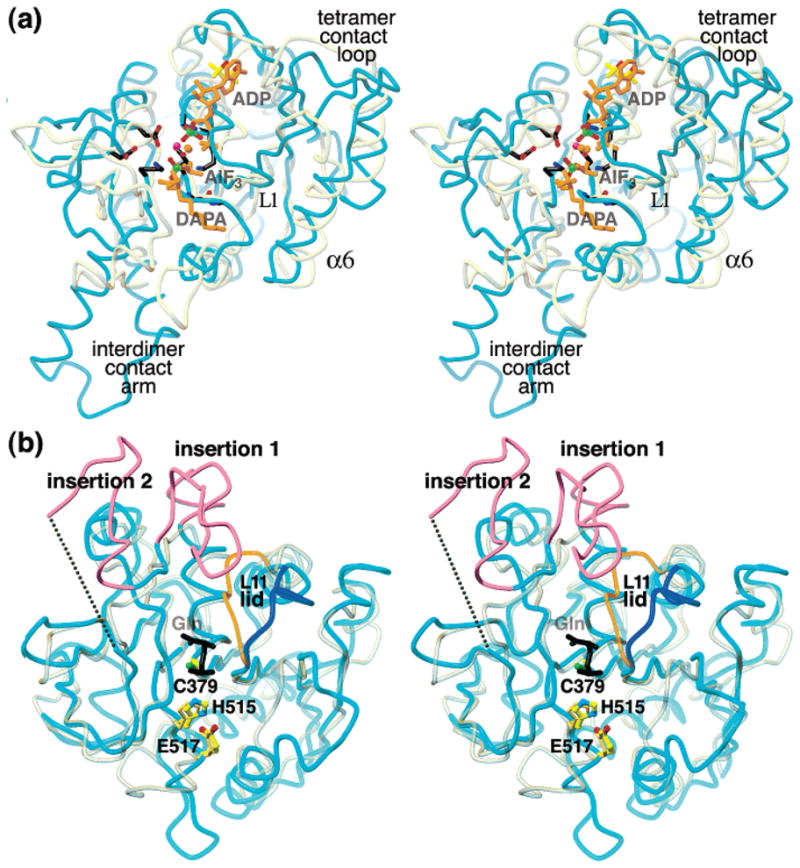
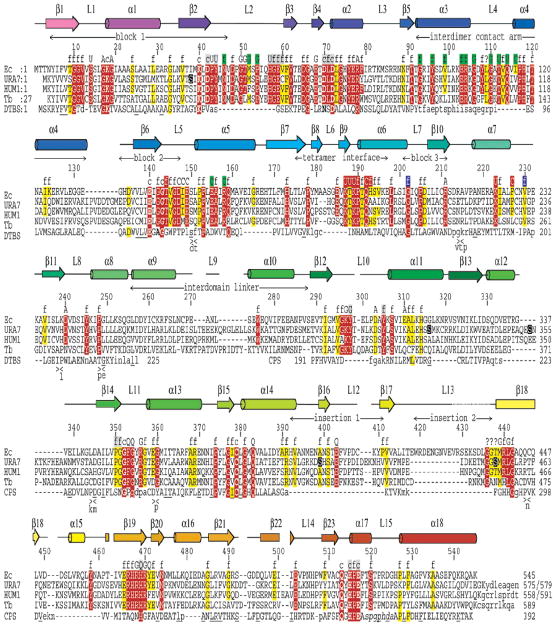
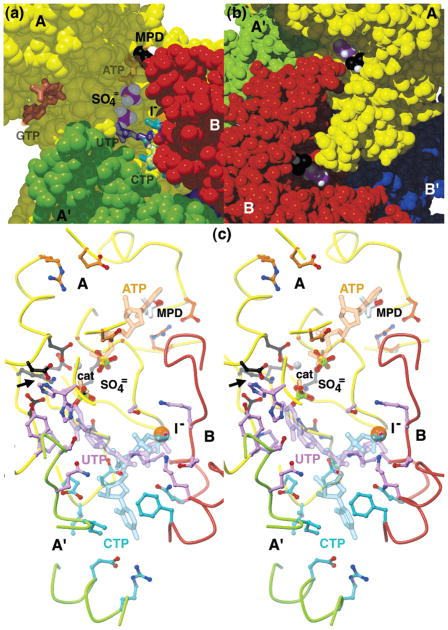
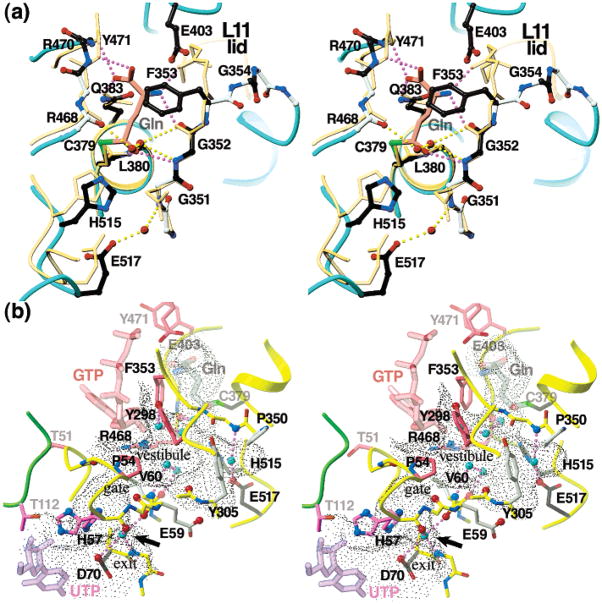
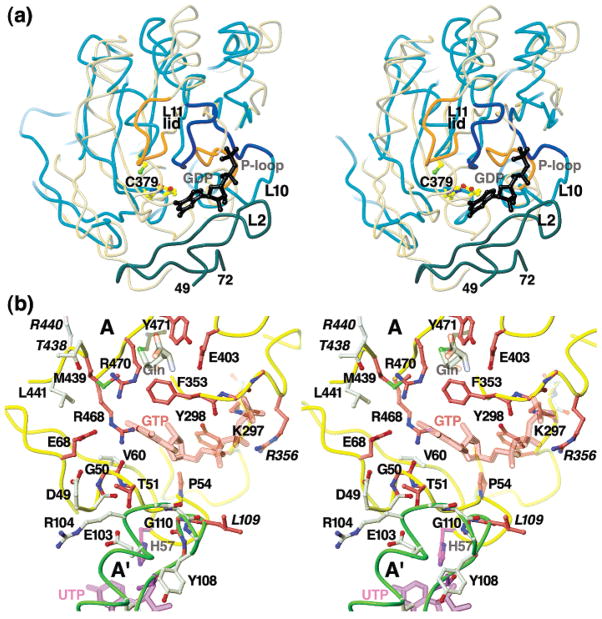
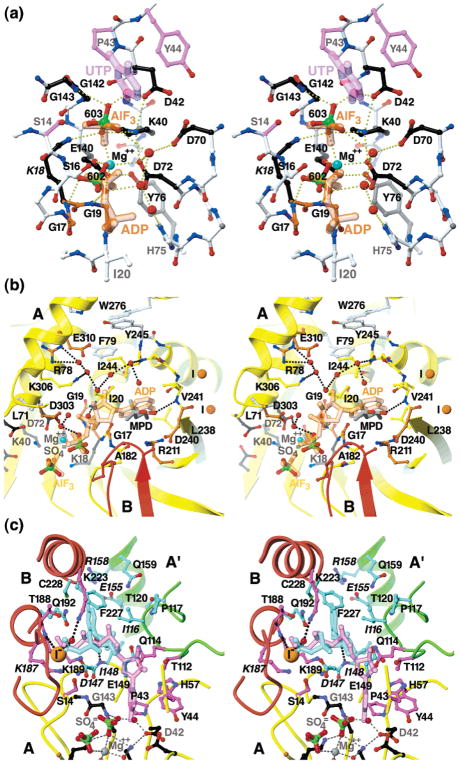
Cytidine triphosphate synthetases (CTPSs) produce CTP from UTP and glutamine, and regulate intracellular CTP levels through interactions with the four ribonucleotide triphosphates. We solved the 2.3-A resolution crystal structure of Escherichia coli CTPS using Hg-MAD phasing. The structure reveals a nearly symmetric 222 tetramer, in which each bifunctional monomer contains a dethiobiotin synthetase-like amidoligase N-terminal domain and a Type 1 glutamine amidotransferase C-terminal domain. For each amidoligase active site, essential ATP- and UTP-binding surfaces are contributed by three monomers, suggesting that activity requires tetramer formation, and that a nucleotide-dependent dimer-tetramer equilibrium contributes to the observed positive cooperativity. A gated channel that spans 25 A between the glutamine hydrolysis and amidoligase active sites provides a path for ammonia diffusion. The channel is accessible to solvent at the base of a cleft adjoining the glutamine hydrolysis active site, providing an entry point for exogenous ammonia. Guanine nucleotide binding sites of structurally related GTPases superimpose on this cleft, providing insights into allosteric regulation by GTP. Mutations that confer nucleoside drug resistance and release CTP inhibition map to a pocket that neighbors the UTP-binding site and can accommodate a pyrimidine ring. Its location suggests that competitive feedback inhibition is affected via a distinct product/drug binding site that overlaps the substrate triphosphate binding site. Overall, the E. coli structure provides a framework for homology modeling of other CTPSs and structure-based design of anti-CTPS therapeutics.


Figures

Figure 1
Figure 1
Reactions and regulation of CTPS and related DTBS. (a) Kinase, glutaminase, and ligase reactions catalyzed by CTPS. UTP is phosphorylated by ATP, and both bind with positive cooperativity. Glutamine hydrolysis, allosterically activated by GTP binding, generates ammonia in a separate active site. Nucleophilic attack of 4-phospho-UTP by ammonia displaces the phosphate, yielding CTP. The CTP product is a feedback inhibitor competitive with UTP substrate. Thus, all four ribonucleotides regulate CTPS activity. (b) Analogous ligase reaction catalyzed by dethiobiotin synthetase (DTBS), a structural homologue of the CTPS N-terminal domain. The precursor DAPA is first carboxylated with CO2 in an ATP-dependent manner (not shown). DAPA carbamate is phosphorylated by ATP, and the product DAPA-carbamoyl phosphate cyclizes by intramolecular nucleophilic attack of the vicinal amino group and elimination of phosphate to yield dethiobiotin.
Figure 2
Figure 2
Oligomeric and monomeric structure of E. coli CTPS (a) Models and typical electron densities from experimental and model-phased maps for the highly conserved ERHRHRYE sequence, residues 465–472. The best-phased solvent-flattened 3.0-Å resolution map (upper left, see Experimental Procedures) was greatly improved by 2-fold averaging and phase extension to 2.6-Å resolution (upper right). Starting with the 2.6-Å model (gray sticks), several rounds of model building and refinement yielded the final 2.3-Å resolution model (yellow sticks), shown enclosed by the final 2FoFc density map (lower center). (b) Three views of the EcCTPS tetramer, along the crystallographic b axis (left), a axis (right), and c axis (bottom). The unique molecules in the asymmetric unit, A and B, are related to their A′ and B′ symmetry mates by the crystallographic 2-fold axis along c. The tight soluble dimers, A–A′ and B–B′, tetramerize via the A–B and A′–B′ interfaces in response to ATP and UTP binding. (c) Space-filling model of the EcCTPS A monomer (yellow) showing the contact regions, defined as atoms that are within 5 Å of the atoms in the other monomers, colored for the interacting monomer from (b). Conserved residues (see Figure 4) are indicated by the translucent surface. Space-filling models of the bound sulfate ions (purple and white), iodide ion (orange), and MPD (black and white) are shown. The entrance to the glutaminase active site (purple surface in upper domain) is also shown. (d) Ribbon diagram of the EcCTPS A monomer, color coded by sequence position, from the N-terminus (purple) to the C-terminus (red). The colors correspond to those in Figure 4.
Figure 3
Figure 3
Backbone superpositions of EcCTPS domains with homologues. Transformations for superposition were generated by the DALI server (73). (a) EcCTPS N-terminal domain (cyan, residues A1-A264) superimposed on DTBS (yellow-gray, 1BS1 residues A1-A224). The sulfate ions (green and red sticks) from the EcCTPS structure, the DTBS substrate ligands ADP, AlF3, and carboxy-DAPA (orange sticks), and six key residues conserved between the two enzymes (black sticks), are shown. The EcCTPS tetramer interface mediated by loop L1 and helix α6 corresponds to the DTBS dimer interface, but is augmented in CTPS by the “tetramer contact loop”. (b) Superposition of the EcCTPS C-terminal domain (cyan, residues A288-A544) on CPS (yellow-gray, 1CS0 residues B191–B380). The two insertions relative to other GATase proteins are indicated (magenta). The dotted line connects residues 427–438 in lieu of the disordered loop that is omitted from the structure. The Cys–His–Glu catalytic triads are shown (CTPS, atom-colored ball-and-sticks, CPS, beige sticks). The covalently bound GSA transition state analogue from 1CS0 (black sticks, labeled “Gln”) defines the glutamine-binding site. The L11 “lid” segment of EcCTPS (blue) is folded away from the substrate site compared to the corresponding segment in CPS (orange).
Figure 4
Figure 4
Sequence alignments, secondary structure correspondences, and suggested roles for conserved residues. The CTPS sequences of E. coli (Ec, 545 residues, Genbank NP_417260), S. cerevisiae URA7 (URA7, 579 residues, 41% identical and 62% similar to EcCTPS, NP_009514), human CTPS1 (HUM1, 591 residues, 40% identical and 60% similar, NP_001896), and T. brucei (Tb, 589 residues, 37% identical and 57% similar, CAB95405) were aligned with BLAST and adjusted manually based on the structure. The E. coli sequence is numbered every 10 residues above the alignment. The corresponding secondary structures are shown above the alignment, color-coded as in Figure 2d. Horizontal double-arrows denote sequence blocks that constitute key structural elements (“interdomain linker”, “interdimer contact arm”, and “tetramer interface”) that are signatory of the SIMIBI NTPase family (81) (“block 1”, residues 4–46 containing the Walker A P-loop; “block 2”, residues 133–147 containing the Walker B motif; and “block 3”, residues 201–211, containing the NKxD motif), or that are CTPS-specific insertions relative to other GATase proteins (“insertion 1” and “insertion 2”). Highly conserved residues are highlighted in red (present in 41 out of 43 representative sequences) and conserved residues are highlighted in yellow (present in 34 out of 43 representative sequences) (59). The majority of conserved residues stabilize the folded structure by hydrophobic packing, hydrogen bonds, or backbone torsion preferences (labeled “f” above the sequences). The remainder are hypothesized to be involved in ligand recognition (labeled “A”, “U”, “G”, and “C”) or catalysis (labeled “c”) (see text for details). The functions of four residues could not be ascertained (labeled “?”). Some conserved residue labels are shaded according to their proximities to the A′ (green), B (red), or B′ (blue) subunits, relative to A, or because they line the putative ammonia channel (gray). Phosphorylated URA7 Ser residues are highlighted (black). The structure-based alignments of DTBS with EcCTPS residues 2–257 and CPS with EcCTPS residues 289–544 are also shown (bottom line). Underlined residues are identical to EcCTPS. Insertions are indicated as “><” and the inserted residues are shown below. Residues that lack structural homologues in EcCTPS are indicated (lower-case letters).
Figure 5
Figure 5
Surface features in the vicinity of the amidoligase (ALase) active site. (a) Space-filling view into the ALase active site groove showing the proposed locations of the four nucleotide-binding sites. The subunits A (yellow), A′ (green), and B (red) each donate crucial active site surfaces. Each active site contains two sulfate ions (purple and white), an iodide ion (orange), and an MPD molecule (black and white). Hypothetical positions for the ATP (orange), UTP (purple), CTP (cyan), and GTP (dark pink), suggested by structural comparisons, conserved residue patterns and mutation data as described in Experimental Procedures, are shown in translucent thick sticks. The putative CTP-binding site connects the ALase site to a large internal space containing the tetramer center-of-mass. (b) Close-up view looking approximately along the crystallographic b axis, showing the prominent groove that traverses the ATP-binding sites on the A and B subunits. This groove is hydrated and is lined with hydrophobic residues. (c) Summary stereoview of the proposed ALase active site showing the backbone contributions from the A (yellow), A′ (green), and B (red) subunits in coils; the positions of the sulfate ions (green and red ball-and-stick), iodide ion (orange ball), magnesium ion (gray ball), and MPD (red and white sticks); the proposed locations of substrates ATP (orange) and UTP (purple), and the feedback inhibitor CTP (cyan) in translucent sticks. The conserved residues that are suggested to interact with ATP (orange), UTP (purple), CTP (cyan), or promote catalysis (black) are represented in ball-and-stick. The proposed entry site for ammonia is indicated with the black arrow.
Figure 6
Figure 6
Stereo diagrams of the glutaminase active site and the putative ammonia diffusion channel in the A subunit GATase domain. (a) Active site comparison of EcCTPS (cyan backbone coils and colored ball-and-sticks) to the CPS-GSA 1CS0 transition state analogue complex (beige backbone coils and sticks). The CPS was superimposed on EcCTPS using Cys379, Leu380, Gly351 and Gly352 main chain atoms. Covalently bound GSA from 1CS0 is indicated by the pink carbon atoms (“Gln”). Conserved residues are indicated by ball-and-sticks, with black carbon atoms for those suggested to be directly involved with substrate binding. Hydrogen bonds between CPS and GSA are indicated by purple dotted lines, and those between EcCTPS and bound solvent molecules (red balls) are indicated by yellow dotted lines. Two solvent molecules, present in both subunits, occupy the expected positions of the amide nitrogen and carbonyl oxygen of the Gln acylation transition state. The structures differ significantly in the conformation of the L11 “lid”, and the positioning of catalytic His and Glu residues. (b) A solvent-containing vestibule and adjacent tubular channel connects the glutaminase and ALase active sites. Backbone positions from the A subunit (yellow) or A′ subunit (green) are indicated by ribbons or coils. The dot molecular surface was generated by GRASP using a 1.2-Å probe (77). The hypothetical positions of bound GTP, UTP, and glutamine are indicated by translucent sticks. Seven buried solvent molecules that are present in both subunits define a possible ammonia trajectory, and are shown as cyan balls, with their associated hydrogen bonds indicated by yellow dotted lines. Conserved residues that are suggested to be catalytically important (black), that line the proposed UTP (purple) or GTP (red-purple) binding sites, or that line the proposed ammonia channel (gray bonds) are indicated by sticks. Potential hydrogen-bond acceptors are provided by the carbonyl oxygens of Met52, His57, Gly58, Glu59, Val 60, Asp70, Ala304, Arg468, and the carboxylate oxygens of Glu59, Asp70, and Glu517 (red balls). Hydrogen-bond donors are furnished by the amides of Val60, Leu71, and Glu351, and the Arg468 NH1 atom (blue balls), with Tyr298 and His57 side chains contributing additional hydrogen-bonding potential. Both side chain conformations for His57 are shown. The arrow indicates the suggested location of the ultimate or penultimate position of the conducted ammonia based on hydrogen bonding environment. A 3-Å opening at the base of the proposed GTP-binding site may provide entry for exogenous ammonia.
Figure 7
Figure 7
Proposed GTP-binding site based on structural homology to GDP/GTP binding proteins, EcCTPS surface features, and conserved residues. (a) Stereo diagram of superpositions of EcCTPS A subunit C-terminal domain (cyan coils, only residues A288–A390 A438–A473, and A499–A534 are shown for clarity) with elongation factor G/GDP complex (yellow-gray coils, 1DAR residues 12–39, 74–191, 241–280) using DALI server-generated transformation. The position of the bound GDP (black sticks) superimposes near a prominent groove located between the GATase domain and the L2 loop (dark cyan). The equivalent residues of the EF-G P-loop and the CTPS L11 “lid”, colored orange (EF-G) and blue (EcCTPS), are in different conformations. The EcCTPS P-loop would need to undergo substantial rearrangement to achieve the EF-G conformation, while the EF-G “lid” more closely resembles that in CPS. (b) Stereo diagram of the proposed GTP binding cleft. The backbones of the A (yellow) and A′ (green) subunits are represented as coils. The proposed positions of GTP (red-purple), UTP (purple), and the Gln substrate (gray) are indicated by translucent sticks (see Experimental Procedures). The positions of conserved residues proposed to line the GTP-binding (red-purple) or UTP-binding (purple) sites, or to stabilize the folded structure (white) are represented in ball-and-stick. Residues which when mutated interfere with GTP binding are marked with italicized labels.
Figure 8
Figure 8
Stereo diagrams showing the atomic details of the proposed (a) catalytic, (b) ATP, and (c) UTP/CTP subsites in the EcCTPS A subunit. The carbon atoms of conserved residues are colored-coded in ball-and-stick representations by their proposed functions: ATP binding (orange); UTP binding (purple); CTP binding (cyan); or catalysis (black). Hypothetical bound ligands, indicated by similarly color-coded translucent sticks, were placed as described in Experimental Procedures. Solvent molecules present in both A and B subunits are shown (red balls). Hydrogen bonds are indicated by the dotted lines. (a) The proposed catalytic subsite. For clarity, only the UTP uracil ring and C1′ atoms (purple), the ADP α- and β-phosphates, and AlF3 are shown (orange). Nonconserved residues (white) are shown are shown in ball-and-stick. Proposed catalytic residues Gly17, Lys18, Lys40, Asp70, Glu140, and Gly143 are conserved from DTBS. Asp72 occupies a similar position to Asn56 in DTBS. Asp42 is positioned to interact with the uracil O4 position. Hydrogen bonds for γ-phosphate binding and phospho/aminotransfer transition-state stabilization are potentially donated by the Lys18 and Lys40 amino and Gly143 amide nitrogen atoms. A putative magnesium ion (cyan ball), chelated by Asp72 and Glu140 and bridging the bound sulfate ions, directly overlaps the proposed activating magnesium ion in DTBS. The α- and β-phosphates would be recognized by the amides in P-loop residues 17–19, and bridging solvent interactions with Asp72 and His75. Conserved Tyr76 buttresses the active site through interactions with Glu140. (b) Proposed subsite for ATP. For the A (yellow) and B (red) subunits, backbone positions are indicated by ribbons and the nonconserved side chains are indicated by yellow ball-and-sticks. Additional conserved side chains are shown in ball-and-stick with white bonds. Positions of the magnesium ion (cyan), solvent molecules (red), and nearby iodine ions (“I”, orange) are indicated by balls. Hydrogen bonds are indicated by black dotted lines. ADP from the DTBS 1BS1 structure (translucent orange sticks) overlaps the EcCTPS-bound sulfate ions (green and red ball-and-sticks) and MPD molecule (gray and red sticks). By analogy with DTBS, the adenine recognition site is formed by the loop L8 (residues 240–245). (c) Proposed overlapping subsites for UTP substrate and CTP feedback inhibitor. The A (yellow) A′ (green), and B (red) subunit backbone positions are indicated by ribbons. Conserved side chains which line the proposed ligand binding surfaces are shown in color-coded ball-and-stick. For clarity, only the UTP subsite-proximal His57 conformation is shown. Positions of solvent molecules (red) and the iodine ion (“I”, orange) are indicated by balls. Italicized labels indicate sites for which known change-of-function mutations exist (see text for details). The Lys187-Ala substitution abolishes ALase activity in EcCTPS. For the CTP site, some mutations, selected for resistance to CPEC or 5-fluorouracil, resulted in loss of CTP inhibition in CTPSs from C. trachomatis, Asp147-Glu, (56)), and hamster, Ile/Val116-Phe, Gly146-Glu, Ile148-Thr, Leu/Met151-Ile, Glu155-Lys, Arg158-His, and Asn/His229-Lys (57), where bold indicates a conserved residue for CTPSs, and the hamster residue is underlined. Residues Gly146, Ile151, and Asn229 are not shown for clarity. The sulfate/iodide site provide a potential site for binding the UTP or CTP γ-phosphates.

Similar articles

Cited by

References

    1. Liebermann I. Enzymatic Amination of uridine triphosphate to cytidine triphosphate. J Am Chem Soc. 1955;55:2661–2662. - PubMed
    1. Jones ME. Pyrimidine nucleotide biosynthesis in animals: genes, enzymes, and regulation of UMP biosynthesis. Annu Rev Biochem. 1980;49:253–279. - PubMed
    1. Kent C, Carman GM, Spence MW, Dowhan W. Regulation of eukaryotic phospholipid metabolism. FASEB J. 1991;5:2258–2266. - PubMed
    1. Kent C, Carman GM. Interactions among pathways for phosphatidylcholine metabolism, CTP synthesis and secretion through the Golgi apparatus. Trends Biochem Sci. 1999;24:146–150. - PubMed
    1. West TP, O’Donovan GA. Repression of cytidine triphosphate synthetase in Salmonella typhimurium by pyrimidines during uridine nucleotide depletion. J Gen Microbiol. 1982;128:895–899. - PubMed

Publication types

MeSH terms