

A highly Ca2+-sensitive pool of vesicles contributes to linearity at the rod photoreceptor ribbon synapse
- PMID: 15157421
- PMCID: PMC3108437
- DOI: 10.1016/s0896-6273(04)00254-5
A highly Ca2+-sensitive pool of vesicles contributes to linearity at the rod photoreceptor ribbon synapse
Abstract
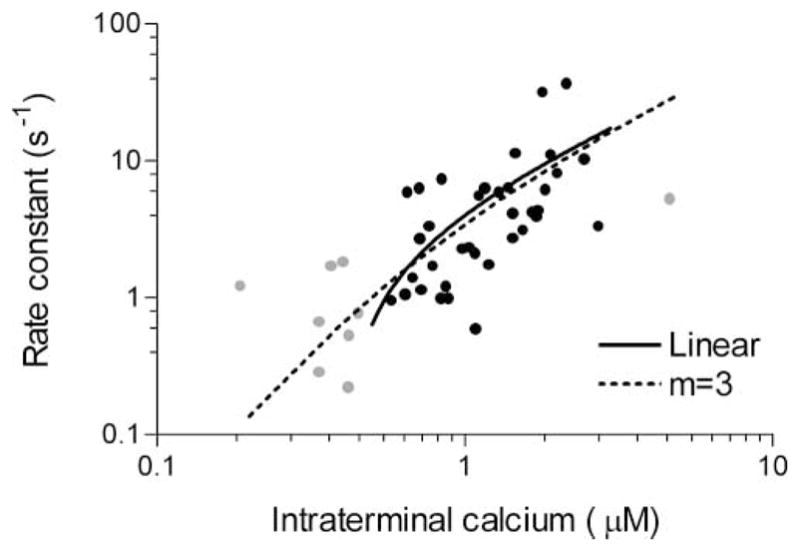
Studies of the properties of synaptic transmission have been carried out at only a few synapses. We analyzed exocytosis from rod photoreceptors with a combination of physiological and ultrastructural techniques. As at other ribbon synapses, we found that rods exhibited rapid kinetics of release, and the number of vesicles in the releasable pool is comparable to the number of vesicles tethered at ribbon-style active zones. However, unlike other previously studied neurons, we identified a highly Ca(2+)-sensitive pool of releasable vesicles with a relatively shallow relationship between the rate of exocytosis and [Ca(2+)](i) that is nearly linear over a presumed physiological range of intraterminal [Ca(2+)]. The low-order [Ca(2+)] dependence of release promotes a linear relationship between Ca(2+) entry and exocytosis that permits rods to relay information about small changes in illumination with high fidelity at the first synapse in vision.
Figures

Similar articles
-
Calcium-dependent inactivation and depletion of synaptic cleft calcium ions combine to regulate rod calcium currents under physiological conditions.Eur J Neurosci. 2002 Dec;16(11):2070-7. doi: 10.1046/j.1460-9568.2002.02277.x. Eur J Neurosci. 2002. PMID: 12473074
-
RIM1/2-Mediated Facilitation of Cav1.4 Channel Opening Is Required for Ca2+-Stimulated Release in Mouse Rod Photoreceptors.J Neurosci. 2015 Sep 23;35(38):13133-47. doi: 10.1523/JNEUROSCI.0658-15.2015. J Neurosci. 2015. PMID: 26400943 Free PMC article.
-
Endogenous calcium buffers regulate fast exocytosis in the synaptic terminal of retinal bipolar cells.Neuron. 2002 Jan 3;33(1):101-12. doi: 10.1016/s0896-6273(01)00565-7. Neuron. 2002. PMID: 11779483
-
Transmission at rod and cone ribbon synapses in the retina.Pflugers Arch. 2021 Sep;473(9):1469-1491. doi: 10.1007/s00424-021-02548-9. Epub 2021 Mar 29. Pflugers Arch. 2021. PMID: 33779813 Free PMC article. Review.
-
Molecular Components of Vesicle Cycling at the Rod Photoreceptor Ribbon Synapse.Adv Exp Med Biol. 2025;1468:325-330. doi: 10.1007/978-3-031-76550-6_54. Adv Exp Med Biol. 2025. PMID: 39930217 Review.
Cited by
-
Perspectives on: information and coding in mammalian sensory physiology: nonlinear spatial encoding by retinal ganglion cells: when 1 + 1 ≠ 2.J Gen Physiol. 2011 Sep;138(3):283-90. doi: 10.1085/jgp.201110629. J Gen Physiol. 2011. PMID: 21875977 Free PMC article. No abstract available.
-
Conical tomography of a ribbon synapse: structural evidence for vesicle fusion.PLoS One. 2011 Mar 1;6(3):e16944. doi: 10.1371/journal.pone.0016944. PLoS One. 2011. PMID: 21390245 Free PMC article.
-
Global Ca2+ signaling drives ribbon-independent synaptic transmission at rod bipolar cell synapses.J Neurosci. 2014 Apr 30;34(18):6233-44. doi: 10.1523/JNEUROSCI.5324-13.2014. J Neurosci. 2014. PMID: 24790194 Free PMC article.
-
TRPV1 and Endocannabinoids: Emerging Molecular Signals that Modulate Mammalian Vision.Cells. 2014 Sep 12;3(3):914-38. doi: 10.3390/cells3030914. Cells. 2014. PMID: 25222270 Free PMC article. Review.
-
Weak endogenous Ca2+ buffering supports sustained synaptic transmission by distinct mechanisms in rod and cone photoreceptors in salamander retina.Physiol Rep. 2015 Sep;3(9):e12567. doi: 10.14814/phy2.12567. Physiol Rep. 2015. PMID: 26416977 Free PMC article.
References
-
- Abe H, Yamamoto TY. Diurnal changes in synaptic ribbons of rod cells of the turtle. J Ultrastruct Res. 1984;86:246–251. - PubMed
-
- Adly MA, Spiwoks-Becker I, Vollrath L. Ultrastructural changes of photoreceptor synaptic ribbons in relation to time of day and illumination. Invest Ophthalmol Vis Sci. 1999;40:2165–2172. - PubMed
-
- Attwell D, Borges S, Wu SM, Wilson M. Signal clipping by the rod output synapse. Nature. 1987;328:522–524. - PubMed
-
- Augustine GJ. How does calcium trigger neurotransmitter release? Curr Opin Neurobiol. 2001;11:320–326. - PubMed
Publication types
MeSH terms
Substances
Grants and funding
LinkOut - more resources
Full Text Sources
Other Literature Sources
Research Materials
Miscellaneous
