. 2004 Jun;164(6):2189-202.
doi: 10.1016/S0002-9440(10)63776-5.

Kinetics of gene expression in murine cutaneous graft-versus-host disease

Affiliations

Kinetics of gene expression in murine cutaneous graft-versus-host disease

Philip B Sugerman et al. Am J Pathol. 2004 Jun.

Abstract

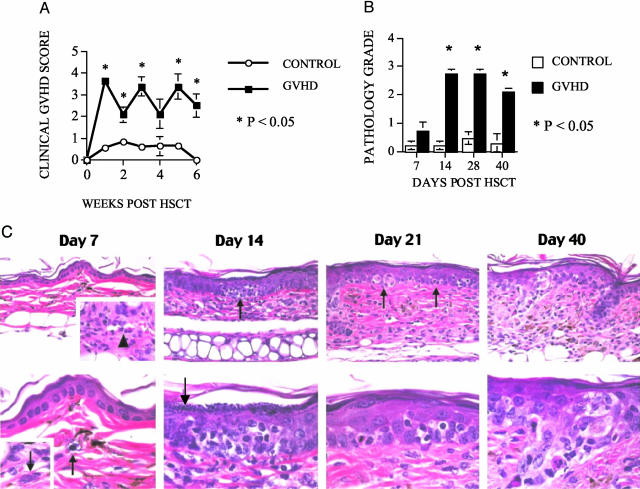
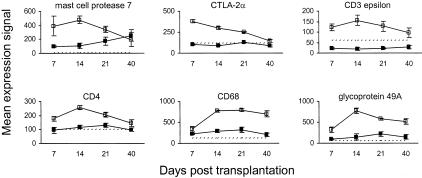
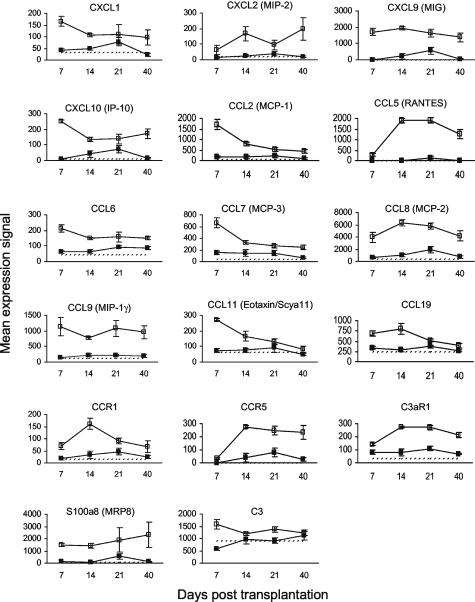
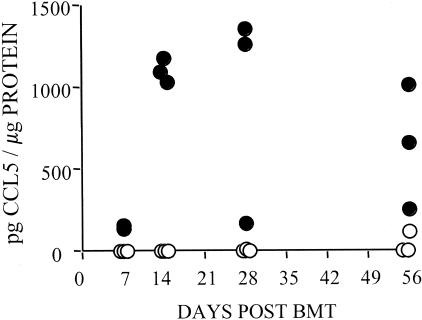
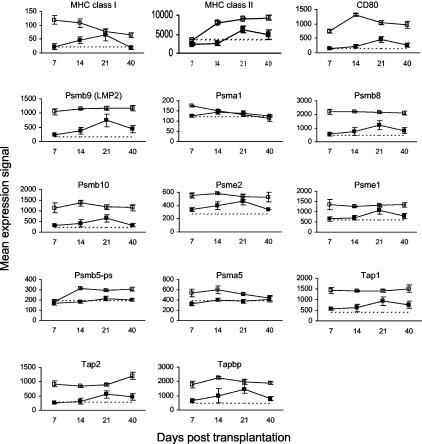
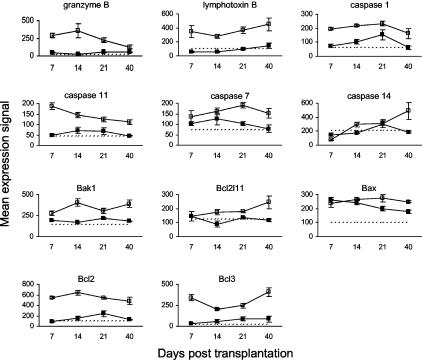
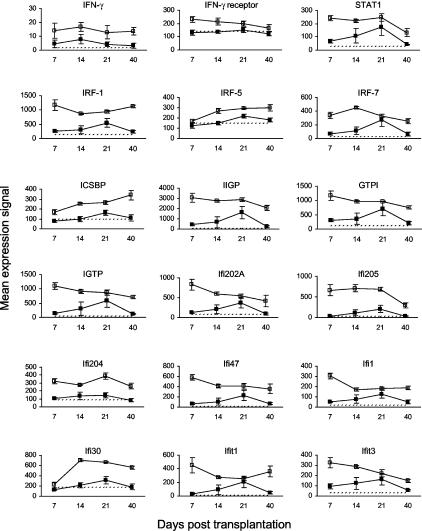
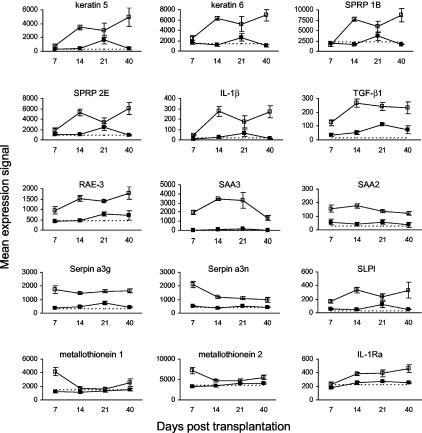
The kinetics of gene expression associated with the development of cutaneous graft-versus-host disease (GVHD) were examined in a mouse model of MHC-matched allogeneic hematopoietic stem cell transplantation. Ear skin was obtained from recipient mice with or without GVHD between 7 and 40 days after transplantation for histopathological analysis and gene expression profiling. Gene expression patterns were consistent with early infiltration and activation of CD8(+) T and mast cells, followed by CD4(+) T, natural killer, and myeloid cells. The sequential infiltration and activation of effector cells correlated with the histopathological development of cutaneous GVHD and was accompanied by up-regulated expression of many chemokines and their receptors (CXCL-1, -2, -9, and -10; CCL-2, -5, -6, -7, -8, -9, -11, and -19; CCR-1 and CCR-5), adhesion molecules (ICAM-1, CD18, Ly69, PSGL-1, VCAM-1), molecules involved in antigen processing and presentation (TAP1 and TAP2, MHC class I and II, CD80), regulators of apoptosis (granzyme B, caspase 7, Bak1, Bax, and BclII), interferon-inducible genes (STAT1, IRF-1, IIGP, GTPI, IGTP, Ifi202A), stimulators of fibroblast proliferation and matrix synthesis (interleukin-1beta, transforming growth factor-beta1), and markers of keratinocyte proliferation (keratins 5 and 6), and differentiation (small proline-rich proteins 2E and 1B). Many acute-phase proteins were up-regulated early in murine cutaneous GVHD including serum amyloid A2 (SAA2), SAA3, serpins a3g and a3n, secretory leukocyte protease inhibitor, and metallothioneins 1 and 2. The kinetics of gene expression were consistent with the evolution of cutaneous pathology as well as with current models of disease progression during cutaneous GVHD.


Figures

Figure 1
Figure 1
Lethally irradiated recipients of allogeneic TCD-BM with T cells develop systemic and cutaneous GVHD by clinical and histopathological criteria. Lethally irradiated (1300 cGy) CBA/J recipients received TCD-BM cells (5 × 10⁶) with (GVHD) or without (control) 1 × 10⁶ splenic T cells. A: Clinical GVHD was determined weekly using a semiquantitative scoring system as described in Materials and Methods. B: Four mice per group were sacrificed on days 7, 14, and 21 after HSCT and four GVHD and three control mice on day 40 after HSCT. Ears were harvested for semiquantitative histopathological analysis of cutaneous GVHD. C: Histopathological analysis of ear skin from animals with GVHD on days 7, 14, 21, and 40 after transplantation revealed a pattern of sequential alterations that correlated with allostimulation, homing, and targeting stages of disease progression. On day 7 after HSCT (late allostimulation/early homing stage), the skin appeared relatively normal, with the only pathological changes consisting of rare dermal vessels [top (inset, arrowhead)] cuffed by occasional lymphocytes and dermal mast cells containing clear cytoplasmic vacuoles indicating degranulation [bottom, arrow; compare with fully-granulated mast cell (inset, arrow) from control animal]. By day 14 (homing/early targeting stage), lymphocytes were diffusely present within the dermis and focally within the epidermal layer in association with early apoptosis (top, arrow, and at higher magnification at bottom). On day 14 and thereafter, the epidermal thickness was twice that observed on day 7 and the superficial epidermis exhibited marked hypergranulosis (bottom, arrow). By days 21 and 40 (targeting stage), there were multiple foci of epidermal apoptosis (day 21: top, arrows; day 40: top panel to left of field; higher magnifications depicted in respective bottom panels). Note also that at the day 21 and 40 time points, the entire dermal thickness (top) was more than twice that observed on days 7 and 14 after HSCT.
Figure 2
Figure 2
Kinetics of effector cell gene expression in murine cutaneous GVHD. Mice were transplanted as described in Figure 1. On days 7, 14, 21, and 40 after transplantation, four mice per group were sacrificed (except day 40 control group: three mice) and RNA was obtained from ear skin. Data shown are mean gene expression signals (±SE) in GVHD (open squares) and control (closed squares) groups. The dotted line represents the mean gene expression signal in untreated CBA/J mice (n = 4).
Figure 3
Figure 3
Kinetics of gene expression for chemokines and their receptors in murine cutaneous GVHD. Mice were transplanted as described in Figure 1. On days 7, 14, 21, and 40 after transplantation, four mice per group were sacrificed (except day 40 control group: three mice) and RNA was obtained from ear skin. Data shown are mean gene expression signals (±SE) in GVHD (open squares) and control (closed squares) groups. The dotted line represents the mean gene expression signal in untreated CBA/J mice (n = 4).
Figure 4
Figure 4
Kinetics of CCL-5 (RANTES) protein concentration in murine cutaneous GVHD. Mice were transplanted as described in Figure 1. On days 7, 14, 28, and 56 after transplantation, three mice per group were sacrificed and ear skin was harvested and homogenized. Data shown are CCL-5 concentrations (pg CCL-5/μg total protein) in ear skin homogenates as determined by ELISA from individual GVHD (filled circle) and control (open circle) mice.
Figure 5
Figure 5
Kinetics of gene expression for adhesion molecules and their ligands in murine cutaneous GVHD. Mice were transplanted as described in Figure 1. On days 7, 14, 21, and 40 after transplantation, four mice per group were sacrificed (except day 40 control group: three mice) and RNA was obtained from ear skin. Data shown are mean gene expression signals (±SE) in GVHD (open squares) and control (closed squares) groups. The dotted line represents the mean gene expression signal in untreated CBA/J mice (n = 4).
Figure 6
Figure 6
Kinetics of gene expression for molecules involved in antigen processing and presentation in murine cutaneous GVHD. Mice were transplanted as described in Figure 1. On days 7, 14, 21, and 40 after transplantation, four mice per group were sacrificed (except day 40 control group: three mice) and RNA was obtained from ear skin. Data shown are mean gene expression signals (±SE) in GVHD (open squares) and control (closed squares) groups. The dotted line represents the mean gene expression signal in untreated CBA/J mice (n = 4).
Figure 7
Figure 7
Kinetics of gene expression for molecules involved in the regulation of apoptosis in murine cutaneous GVHD. Mice were transplanted as described in Figure 1. On days 7, 14, 21, and 40 after transplantation, four mice per group were sacrificed (except day 40 control group: three mice) and RNA was obtained from ear skin. Data shown are mean gene expression signals (±SE) in GVHD (open squares) and control (closed squares) groups. The dotted line represents the mean gene expression signal in untreated CBA/J mice (n = 4).
Figure 8
Figure 8
Kinetics of gene expression for molecules inducible by IFN-γ in murine cutaneous GVHD. Mice were transplanted as described in Figure 1. On days 7, 14, 21, and 40 after transplantation, four mice per group were sacrificed (except day 40 control group: three mice) and RNA was obtained from ear skin. Data shown are mean gene expression signals (±SE) in GVHD (open squares) and control (closed squares) groups. The dotted line represents the mean gene expression signal in untreated CBA/J mice (n = 4). The apparent up-regulation of IFN-γ expression was not statistically significant because mean expression in both GVHD and control groups was below the limit of detection.
Figure 9
Figure 9
Kinetics of gene expression related to keratinocyte proliferation and differentiation, dermal fibrosis, and acute-phase proteins in murine cutaneous GVHD. Mice were transplanted as described in Figure 1. On days 7, 14, 21, and 40 after transplantation, four mice per group were sacrificed (except day 40 control group: three mice) and RNA was obtained from ear skin. Data shown are mean gene expression signals (±SE) in GVHD (open squares) and control (closed squares) groups. The dotted line represents the mean gene expression signal in untreated CBA/J mice (n = 4).

References

    1. Ferrara JL, Deeg HJ. Graft-versus-host disease. N Engl J Med. 1991;324:667–674. - PubMed
    1. Korngold B, Sprent J. Lethal graft-versus-host disease after bone marrow transplantation across minor histocompatibility barriers in mice. Prevention by removing mature T cells from marrow. J Exp Med. 1978;148:1687–1698. - PMC - PubMed
    1. Ferrara J, Guillen FJ, Sleckman B, Burakoff SJ, Murphy GF. Cutaneous acute graft-versus-host disease to minor histocompatibility antigens in a murine model: histologic analysis and correlation to clinical disease. J Invest Dermatol. 1986;86:371–375. - PubMed
    1. Cooke KR, Kobzik L, Martin TR, Brewer J, Delmonte J, Jr, Crawford JM, Ferrara JL. An experimental model of idiopathic pneumonia syndrome after bone marrow transplantation: I. The roles of minor H antigens and endotoxin. Blood. 1996;88:3230–3239. - PubMed
    1. Chudin E, Walker R, Kosaka A, Wu SX, Rabert D, Chang TK, Kreder DE. Assessment of the relationship between signal intensities and transcript concentration for Affymetrix GeneChip arrays. Genome Biol. 2002;3:RESEARCH0005. - PMC - PubMed

Publication types