

Reproducibility of nerve fiber thickness, macular thickness, and optic nerve head measurements using StratusOCT
- PMID: 15161831
- PMCID: PMC1993821
- DOI: 10.1167/iovs.03-0514
Reproducibility of nerve fiber thickness, macular thickness, and optic nerve head measurements using StratusOCT
Abstract
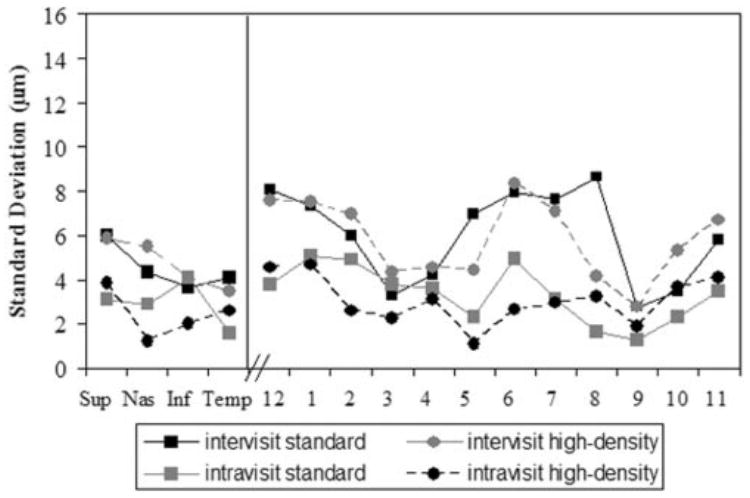
Purpose: The measurement reproducibility of the third generation of commercial optical coherence tomography, OCT-3 (StratusOCT, software ver. A2, Carl Zeiss Meditec Inc., Dublin, CA) was investigated. The nerve fiber layer (NFL) thickness, macula thickness map, and optic nerve head (ONH) parameters in normal eyes were studied.
Methods: Ten normal subjects were imaged six times (three before and three after dilation) per day, and the series was repeated on three different days. The order of the scans before pupil dilation was randomized in each of the 3 days of scanning. After pupil dilation, the scans were also randomized in each of the 3 days of scanning. Each series was performed separately for standard-density (128 A-scans per macular and ONH image and 256 A-scans per NFL image) and high-density (512 A-scans per image for all three scan types) scanning.
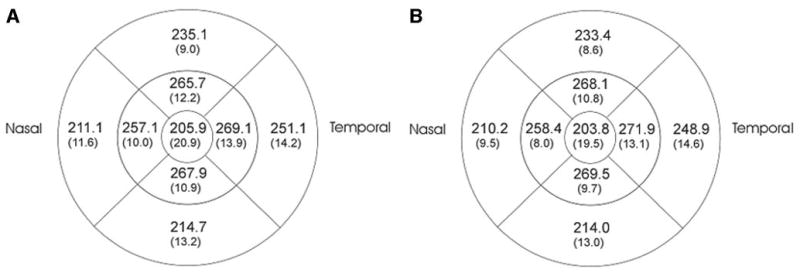
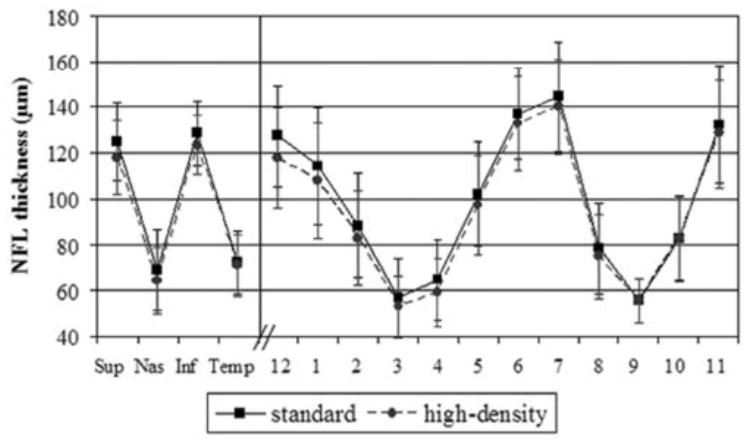
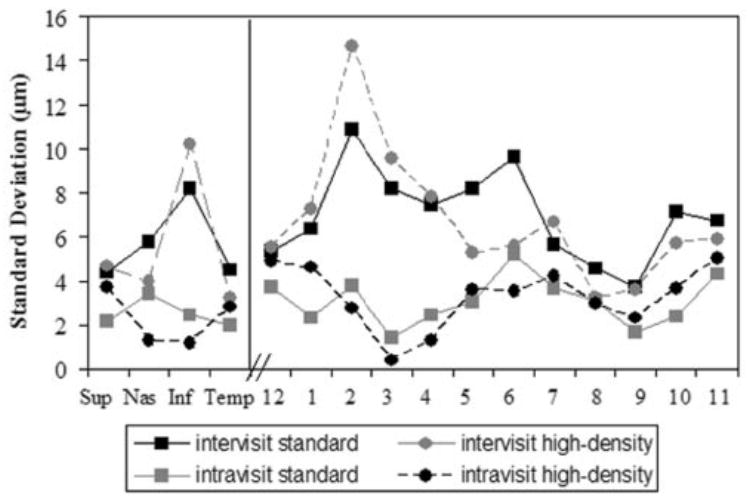
Results: The mean macular thickness was 235 +/- 9.8 micro m. A-scan density (or image acquisition speed) had a statistically significant effect (P < 0.05) on the reproducibility of the mean macular thickness, macular volume, and a few sectors of the macular map. No significant dilation effect was found for any of the macular parameters. The best intraclass correlation coefficient (ICC; 94%) for macular scans was found for dilated high-density scanning, with an intervisit SD of 2.4 micro m and an intravisit SD of 2.2 micro m. The mean NFL thickness for standard scanning was 98 +/- 9 micro m. NFL reproducibility showed mixed results and had interactions between scan density and dilation for some parameters. For most of the NFL parameters, reproducibility was better with dilated standard-density scanning. The mean NFL thickness ICC for dilated standard scanning was 79%, with an intervisit SD of 2.5 micro m and an intravisit SD of 1.6 micro m. For the ONH analysis, the reproducibility was better for dilated standard-density scanning for almost all the parameters, except for disc area, horizontal integrated rim volume, and vertical integrated rim area, which were better before dilation. The best reproducibility was found for cup-to-disc ratio (ICC = 97%, with intervisit SD of 0.04 micro m and intravisit SD of 0.02 micro m).
Conclusions: StratusOCT demonstrated reproducible measurements of NFL thickness, macular thickness, and optic nerve head parameters. The best reproducibility was found for dilated standard scanning for NFL and ONH parameters and for dilated high-density scanning for macular parameters.
Figures
References
-
- Swanson EA, Izatt JA, Hee MR, et al. In vivo retinal imaging by optical coherence tomography. Optics Letters. 1993;18:1864–1866. - PubMed
-
- Fercher AF, Hitzenberger CK, Drexler W, Kamp G, Sattmann H. In vivo optical coherence tomography. Am J Ophthalmol. 1993;116:113–114. - PubMed
-
- Puliafito CA, Hee MR, Lin CP, et al. Imaging of macular diseases with optical coherence tomography (OCT) Ophthalmology. 1995;102:217–229. - PubMed
-
- Hee MR, Puliafito CA, Wong C, et al. Quantitative assessment of macular edema with optical coherence tomography (OCT) Arch Ophthalmol. 1995;113:1019–1029. - PubMed
Publication types
MeSH terms
Grants and funding
LinkOut - more resources
Full Text Sources
Other Literature Sources
Medical
