. 2004 Jun 8;101(23):8768-73.
doi: 10.1073/pnas.0400158101. Epub 2004 May 25.

Two Creutzfeldt-Jakob disease agents reproduce prion protein-independent identities in cell cultures

Affiliations

Two Creutzfeldt-Jakob disease agents reproduce prion protein-independent identities in cell cultures

Alvaro Arjona et al. Proc Natl Acad Sci U S A. .

Abstract

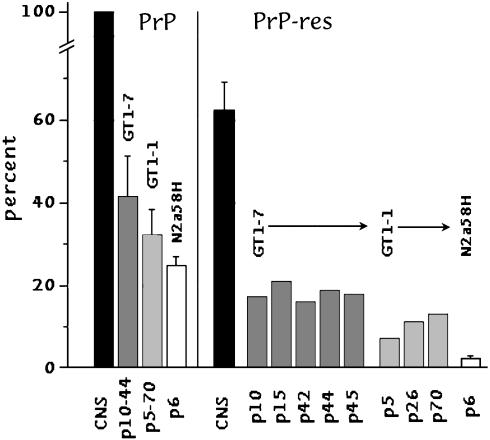
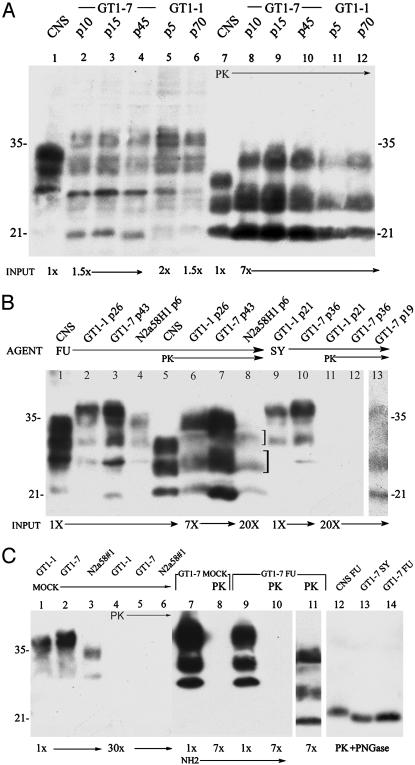
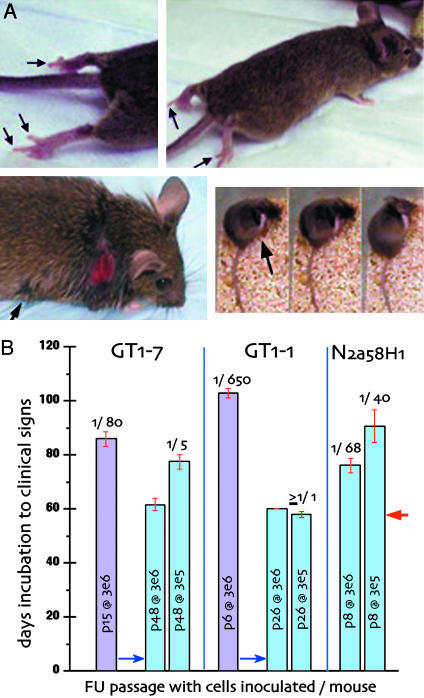
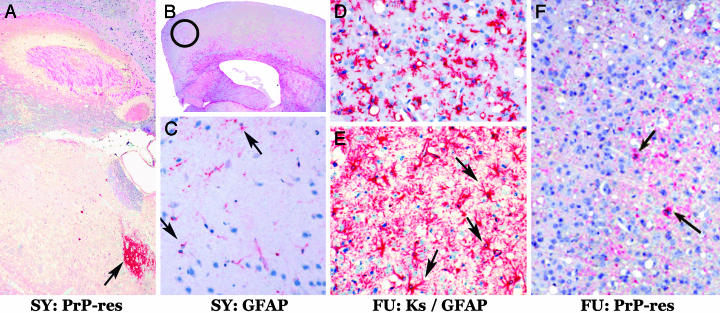
Human Creutzfeldt-Jakob disease (CJD) and similar neurodegenerative diseases such as sheep scrapie are caused by a variety of related infectious agents. They are associated with abnormal host prion protein (PrP), which is assessed by limited proteolysis to yield resistant PrP bands (PrP-res). Although PrP-res has been posited as the infectious agent, purified PrP-res itself is not infectious. To establish the independence of CJD agent characteristics from those of PrP-res, two different mouse-passaged CJD strains were propagated in neuronal cell lines whose PrP-res patterns differ markedly from each other and from those found in infected brain. In mouse brain, the fast CJD strain, FU, elicits many PrP-res deposits, whereas the slow SY strain elicits few. Both strains evoked PrP-res in cultured murine cells, although SY induced PrP-res only transiently. PrP-res patterns in FU- and SY-infected GT1 cells were identical, and were significantly different from those in brain and in N2a cells. Nevertheless, all FU-infected cell lines reproduced their original fast disease in mice, even after extensive subculture, whereas SY-infected cells produced only slow disease. These data indicate PrP-res neither encodes nor alters agent-specific characteristics. PrP-res was also a poor predictor of infectivity because SY cells that had lost PrP-res were approximately 10-fold more infectious than PrP-res-positive cultures. Furthermore, FU titers increased 650-fold, whereas PrP-res remained constant. Passaged FU-infected cells had titers comparable to brain, and >30% of cells displayed abundant cytoplasmic PrP-res aggregates that may trap agent. The continuous substantial replication of CJD in monotypic cells will further the discrimination of agent-specific molecules from pathological host responses to infection.


Figures

Fig. 1.
Fig. 1.
Quantitation of total PrP (Left) and PrP-res (Right) in different passages as compared with FU-infected brain (where total PrP is taken as the 100% standard). Insignificant differences in total PrP expression in each cell line are apparent by the small SEMs. Assay of individual cell passages (p) after infection also show little variation in PrP-res (<2-fold) in GT1 cells.
Fig. 2.
Fig. 2.
Western blots of whole-cell lysates from brain (CNS) and cell lines at different passages. The cell line, CJD agent strain, passage number, and relative protein load applied to each lane is indicated. (A) Total PrP (lanes 1–6) and PrP-res (lanes 7–12; digested with PK) show insignificant changes in PrP-res with extended passages of FU. (B) Relevant passages with relatively low PrP and PrP-res in N2a58H1 cells, and loss of PrP-res in SY GT1–1 cells after p19. (C) Mock controls show no PrP-res (lanes 4–6), and complete removal of N-terminal PrP sequences (lane 10), but not PrP core amyloid sequences (lane 11) after PK digestion. PK followed by PNGase removed glycosyl residues: SY and FU in GT1–7 cells show the same Mr band (lanes 13,14) that is ≈1.5 kDa lower than in the CNS (lane 12). PrP antibody was M20 in A, and C20 in B. Both give the same pattern. The NH2-specific antibody is shown in lanes 7–10. Glycoform ratios of the three major PrP-res bands (±10%, higher to lower Mr) were 1:1.1:0.5 (brain), 0.5:2.1:2 (GT1–7), 1:2.9:3 (GT1–1), and 1:1.3:1.1 (N2a58H1) by using optimal PK digestions and loads. The different glycoform ratios specified cell types but not strain characteristics, as in mammalian tissues (1).
Fig. 3.
Fig. 3.
TGA20 strain assays. (A) FU hind leg paresis (Upper). Note extension of hind digits and supine paw (dragged). (Lower) SY infection with stereotypic scratching leading to neck wound. Patches of scratched rough hair also elsewhere (e.g., arrow, Left). (Right) Three consecutive movie frames (<2 sec per frame) demonstrating rapid leg movement on neck (arrow) with rest of body and tail immobile during scratching. Mice are killed before the skin breaks, but in this case the wound rapidly developed overnight. (B) Infectivity of FU tissue cultures (GT1–7, GT1–1, and N2a58H1). Each bar shows the passage in vitro (p) and the number of cells inoculated per mouse. Blue bars show determinations at two tenfold dilutions. The LD50 per cell is shown at the top of each bar. The minimal incubation time (red arrow) indicates of ≥3 × 10⁵ LD50 per sample; and further cell dilutions may show significantly >1 LD50 per GT1–1 cell. Titers of FU were the same in TGA20 and WT CD-1 mice (see Materials and Methods).
Fig. 4.
Fig. 4.
In situ detection of PrP-res in mock- and FU-infected cell lines at the indicated passages (p). Mock cells produced no PrP-res (Top). GT1–7 cultures showed cytoplasmic aggregates of PrP-res (arrow, Middle). In GT1–1 intracellular PrP-res spread more diffusely (arrow) in many adjacent cells, possibly indicating cell-to-cell spread, except in a few cells with more aggregated deposits (▵). Only a few pyknotic dark blue nuclei are seen in infected cultures despite high PrP-res levels. Trypsin digestion times are indicated, and more extensive digestion in the GT1–1 line did not decrease the PrP-res signal.
Fig. 5.
Fig. 5.
SY and FU agents breed true after extended in vitro propagation. Representative end stage neuropathology of SY (A–C) and FU (D–F) in TGA20 mice. (A) PrP antibodies show PrP-res only in the thalamus (red, arrow) but not the rest of the cerebrum. (B) Antibody to glial fibrillary acidic protein (GFAP) (21) shows no cortical astrogliosis (red) in SY mice. Red astrocytes, normally found in the white matter, are apparent. Circle denotes the same cortical region from different mice shown in C–F.(C) SY-infected GT1–7 cell homogenates produced no cortical vacuolization and only rare small GFAP-positive cells (arrows); the same result was obtained by using SY brain homogenates. Microglia, assessed by keratan sulfate antibody (Ks) staining (21), were not found with SY inocula (data not shown). (D) FU infection elicited many keratan sulfate-positive (red) microglia after inoculation of FU-infected GT1–7 cell homogenates. Note the many vacuoles. The pathology was the same by using FU GT1–1, FU N2a58H1, or FU brain homogenates. (E) FU infection also elicited intense GFAP staining (red) of many astrocytic fibers as well as hypertrophic (gemistocytic astrocyte) cell bodies (arrows). This massive astrocytosis was apparent by the naked eye in all FU infections regardless of source (cells or brain). (F) Many cortical vacuoles are again seen after FU GT1–1 inocula. All FU-infected TGA20 mice displayed only a few small deposits of PrP-res, which contrasts with the frequent larger deposits in CD-1 mice (15, 16). TGA20 mice also show a higher (red) background of normal PrP because they overexpress this protein by 8-fold versus WT mice (22). The cytological reduction in PrP-res deposits was also confirmed by a 4-fold reduction of PrP-res per mg of brain in TGA20 versus WT mice by Western blotting (data not shown). Nevertheless, vacuolization was comparable in TGA20 and CD-1 mice, and spongiform change does not invariably correspond to PrP-res levels (21).

References

    1. Manuelidis, L. (2003) Viral Immunol. 16, 123–139. - PubMed
    1. Manuelidis, E. E., Fritch, W. W., Kim, J. H. & Manuelidis, L. (1987) Proc. Natl. Acad. Sci. USA 84, 871–875. - PMC - PubMed
    1. Race, R. (1991) Curr. Top. Microbiol. Immunol. 172, 181–193. - PubMed
    1. Manuelidis, L., Murdoch, G. & Manuelidis, E. (1988) Ciba Found. Symp. 135, 117–134. - PubMed
    1. Manuelidis, L. & Fritch, W. (1996) Virology 215, 46–59. - PubMed

Publication types