

A transmission disequilibrium test for general pedigrees that is robust to the presence of random genotyping errors and any number of untyped parents
- PMID: 15162128
- PMCID: PMC1356564
- DOI: 10.1038/sj.ejhg.5201219
A transmission disequilibrium test for general pedigrees that is robust to the presence of random genotyping errors and any number of untyped parents
Abstract
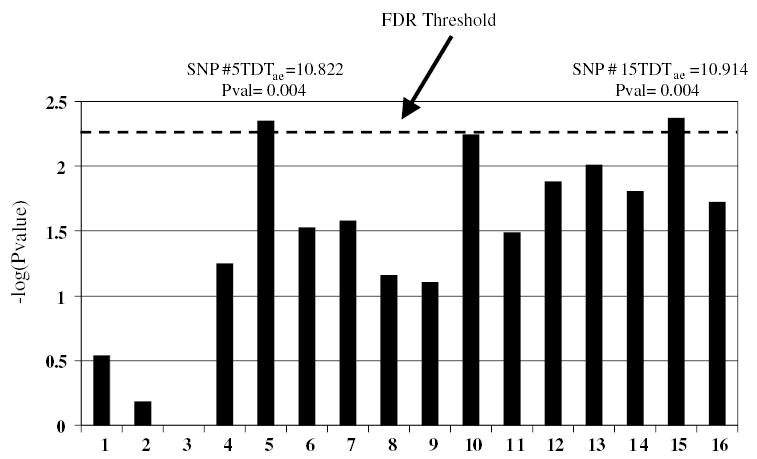
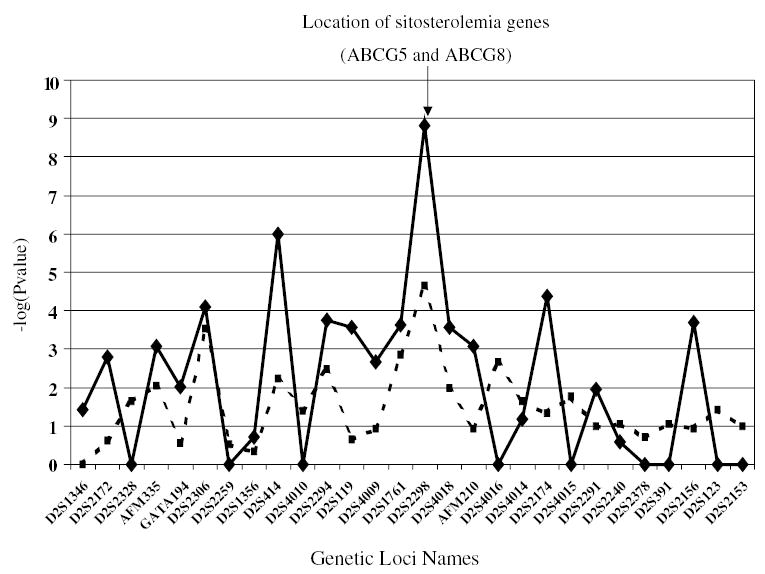
Two issues regarding the robustness of the original transmission disequilibrium test (TDT) developed by Spielman et al are: (i) missing parental genotype data and (ii) the presence of undetected genotype errors. While extensions of the TDT that are robust to items (i) and (ii) have been developed, there is to date no single TDT statistic that is robust to both for general pedigrees. We present here a likelihood method, the TDT(ae), which is robust to these issues in general pedigrees. The TDT(ae) assumes a more general disease model than the traditional TDT, which assumes a multiplicative inheritance model for genotypic relative risk. Our model is based on Weinberg's work. To assess robustness, we perform simulations. Also, we apply our method to two data sets from actual diseases: psoriasis and sitosterolemia. Maximization under alternative and null hypotheses is performed using Powell's method. Results of our simulations indicate that our method maintains correct type I error rates at the 1, 5, and 10% levels of significance. Furthermore, a Kolmorogov-Smirnoff Goodness of Fit test suggests that the data are drawn from a central chi2 with 2 df, the correct asymptotic null distribution. The psoriasis results suggest two loci as being significantly linked to the disease, even in the presence of genotyping errors and missing data, and the sitosterolemia results show a P-value of 1.5 x 10(-9) for the marker locus nearest to the sitosterolemia disease genes. We have developed software to perform TDT(ae) calculations, which may be accessed from our ftp site.
Figures
References
-
- Ott J: Analysis of Human Genetic Linkage Baltimore: The Johns Hopkins University Press; 1999.
-
- Breslow NE, Day NE: Statistical Methods in Cancer Research Lyon: International Agency for Research on Cancer; 1980, p 350.
-
- Falk CT, Rubinstein P. Haplotype relative risks: an easy reliable way to construct a proper control sample for risk calculations. Ann Hum Genet. 1987;51:227–233. - PubMed
-
- Terwilliger JD, Ott J. A haplotype-based ‘haplotype relative risk’ approach to detecting allelic associations. Hum Hered. 1992;42:337–346. - PubMed
Publication types
MeSH terms
Grants and funding
LinkOut - more resources
Full Text Sources
Other Literature Sources
Miscellaneous
