Review
. 2004 Jun;57(6):561-76.
doi: 10.1136/jcp.2003.009910.

Mouse models of childhood cancer of the nervous system

Affiliations
Review

Mouse models of childhood cancer of the nervous system

M A Dyer. J Clin Pathol. 2004 Jun.

Erratum in

  • J Clin Pathol. 2004 Aug;57(8):896

Abstract

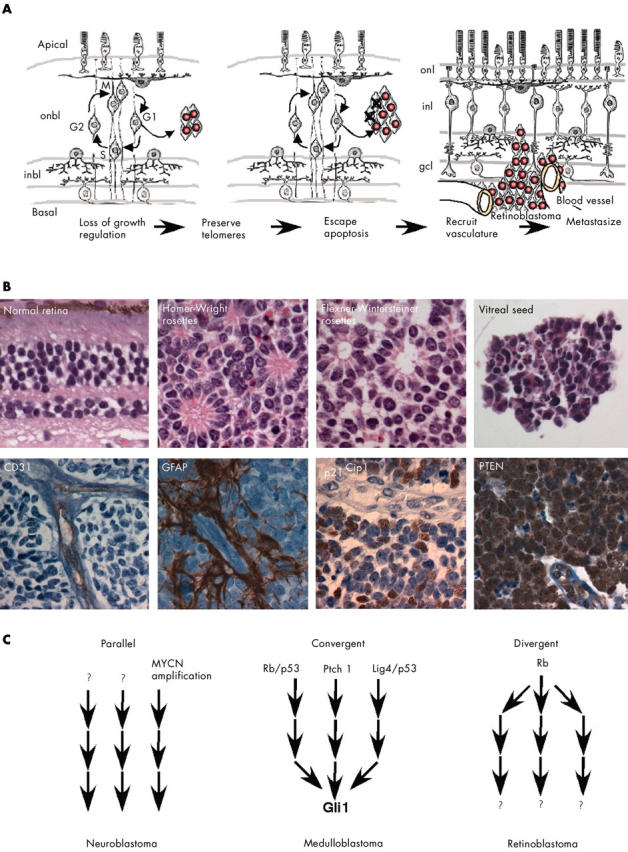
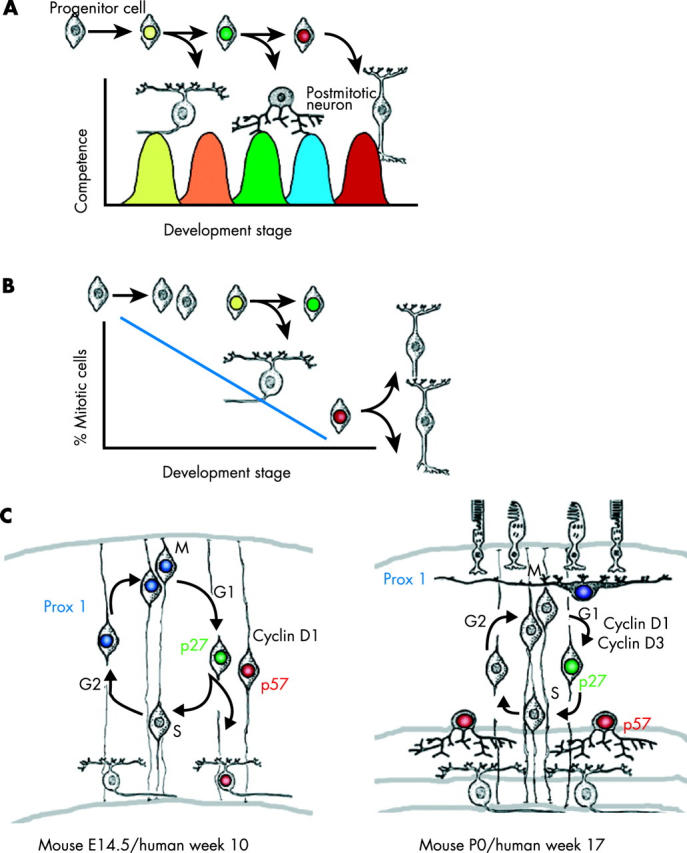
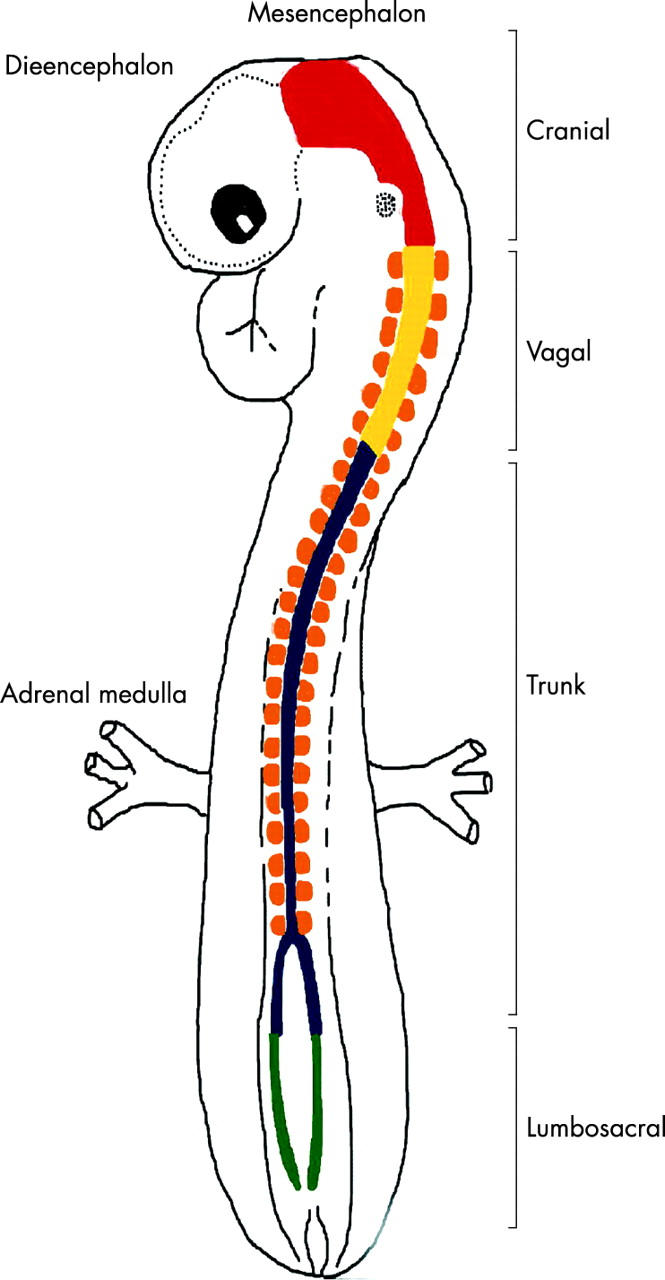
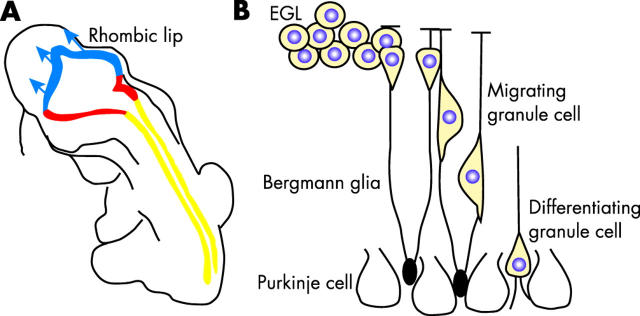
Targeted cancer treatments rely on understanding signalling cascades, genetic changes, and compensatory programmes activated during tumorigenesis. Increasingly, pathologists are required to interpret molecular profiles of tumour specimens to target new treatments. This is challenging because cancer is a heterogeneous disease-tumours change over time in individual patients and genetic lesions leading from preneoplasia to malignancy can differ substantially between patients. For childhood tumours of the nervous system, the challenge is even greater, because tumours arise from progenitor cells in a developmental context different from that of the adult, and the cells of origin, neural progenitor cells, show considerable temporal and spatial heterogeneity during development. Thus, the underlying mechanisms regulating normal development of the nervous system also need to be understood. Many important advances have come from model mouse genetic systems. This review will describe several mouse models of childhood tumours of the nervous system, emphasising how understanding the normal developmental processes, combined with mouse models of cancer and the molecular pathology of the human diseases, can provide the information needed to treat cancer more effectively.


Figures

Figure 1
Figure 1
Tumours exhibit temporal and spatial heterogeneity. (A) The transition from preneoplastic lesion to metastatic cancer is believed to involve multiple genetic or epigenetic changes including growth factor independence, escape of apoptosis, preservation of telomeres, recruitment of vasculature, and acquisition of invasive properties. (B) Retinoblastomas exhibit histological heterogeneity, such as Homer-Wright rosettes, which lack a lumen, and Flexner-Wintersteiner rosettes, which contain an obvious lumen. Another histological feature of some retinoblastomas are vitreal seeds, which are small clusters of cells that are free floating in the vitreous of the eye. In some tumours, glial fibrilary acidic protein (GFAP) immunopositive glial cells surround the vessels (CD31), whereas in other tumours, such glial association is absent. The protein p21 is an example of molecular heterogeneity in retinoblastoma. Some nuclei of the viable tumour are clearly p21 immunopositive, and others are p21 immunonegative. In contrast, PTEN is expressed in almost all retinoblastoma cells. (C) Different pathways lead to tumorigenesis. In neuroblastoma, MYCN amplification accounts for a subset of the most aggressive tumours, and serial analysis of the same tumours revealed that tumours lacking MYCN amplification early, rarely acquire such mutations later. Thus, there are probably distinct pathways (MYCN amplification and non-MYCN amplification) that lead to neuroblastoma. In medulloblastoma in the mouse, a variety of genetic alterations can lead to tumour formation. Interestingly, many of these mutations in distinct pathways eventually lead to Gli1 activation, which is important for tumour proliferation. Thus, disparate pathways may converge on a common target, Gli1. In retinoblastoma, most tumours share a common initiating event—RB (the retinoblastoma gene) inactivation. After RB inactivation and subsequent deregulated growth, the different tumours might progress down distinct, divergent pathways leading to malignant transformation. gcl, ganglion cell layer; inbl, inner nuclear basal layer; inl, inner nuclear layer; onbl, outer nuclear basal layer; onl, outer nuclear layer.
Figure 2
Figure 2
Neural progenitor cells exhibit temporal and spatial heterogeneity. (A) During the development of the nervous system, progenitor cells pass through distinct stages of competence in a unidirectional manner. These stages are defined by the ability of progenitor cells to give rise to different subsets of differentiated neurones or glia. For example, early stage progenitor cells are competent to give rise to only early born cell types, and late stage progenitor cells are competent to give rise to only late born cell types. (B) Patterns of proliferation or cell division change over time in concert with the changes in progenitor cell competence. Early during development, progenitor cells tend to give rise to more proliferating, immature progenitor cells. Later, a mixture of postmitotic daughter cells and mitotic daughter cells is generated. At the end of histogenesis, neural progenitor cells undergo terminal cell cycle exit and produce postmitotic neurones and glia. Neural progenitor cells may be more susceptible to transformation at particular stages of development. (C) Some of the molecules involved in the temporal and spatial heterogeneity of the developing retina have been identified. These include both cell cycle proteins (p27, p57, cyclin D1, and cyclin D3) and transcription factors (Prox1). In the embryonic retina, some progenitor cells use p27 to exit the cell cycle, and others use p57; this is an example of spatial heterogeneity. Similar results have been obtained with cyclins D1 and D3. Prox1 is expressed in a subset of dividing retinal progenitor cells embryonically, a finding that indicates that there is spatial heterogeneity for this homeobox gene. Interestingly, Prox1 also exhibits temporal heterogeneity, because late stage progenitor cells do not use Prox1 at all. During later stages of development, Prox1 is expressed only in postmitotic horizontal cells. E, embryonic day; P, postnatal day.
Figure 3
Figure 3
Spatial heterogeneity of the neural crest. The developing neural crest can be divided into four regions based on the migration of the neural crest progenitor cells and fates adopted by their daughter cells. For example, cranial neural crest cells give rise to sensory ganglia and facial cartilage; vagal neural crest and lumbosacral neural crest cells populate the enteric nervous system; and the trunk neural crest cells give rise to melanocytes, Schwann cells, and adrenal medulla. Neuroblastoma is believed to arise from trunk neural crest progenitor cells.
Figure 4
Figure 4
The cerebellum is generated from two distinct progenitor cell populations. (A) The granule cells are produced from progenitor cells that migrate from the rhombic lip early during development. Once they arrive at the developing cerebellum, these cells proliferate extensively to produce the external germinal layer (EGL). (B) After this period of proliferation, the granule cell progenitors migrate along the processes of the Bergmann glia and begin to differentiate. Sonic hedgehog secreted by the Purkinje cells regulates the proliferation of the granule cell progenitors in the EGL, which express the hedgehog receptor, patched. Some forms of medulloblastoma are believed to arise from granule cell precursors that have sustained mutations in the hedgehog signalling pathway.
Figure 5
Figure 5
Hedgehog signalling leads to Gli1 activation. (A) In the absence of hedgehog (Hh) its receptor patched (Ptc) blocks smoothened (Smo), which leads to sequestering of the Gli1 transcription factor by a complex made up of Cos2, SUFU, Fu, and microtubules. Expression of Gli1 target genes is reduced in the absence of Hh signalling. (B) When hedgehog is present, Smo is no longer repressed and releases Gli1 to move into the nucleus and activate transcription of Gli1 target genes.
Figure 6
Figure 6
Wnt signalling leads to β catenin stabilisation. (A) In the absence of Wnt signalling through its frizzled (Frz) receptor, the β catenin transcriptional regulator is degraded by a complex made up of AXIN1, GSK-3β, and APC. As a consequence, β catenin responsive genes are transcriptionally inactive, in part as a result of repression by the groucho (Gro) repressor. (B) When Wnt binds to the Frz receptor, degradation of β catenin is blocked;β catenin translocates to the nucleus and activates transcription of β catenin responsive genes through the T cell factor/lymphoid enhancer factor (TCF/LEF) family of transcriptional regulators.
Figure 7
Figure 7
Retinal neurones and glia are generated in an evolutionarily conserved order during development. (A) The seven classes of retinal cell types (rods, cones, bipolar cells, amacrine cells, horizontal cells, ganglion cells, and Müller glia) are generated in a precise order during development. As in other regions of the nervous system, retinal progenitor cells are thought to undergo unidirectional changes in competence to give rise to the different retinal cell types. Retinoblastoma is thought to arise from a retinal progenitor cell, and depending on when during development the second RB allele is mutated, the tumour may express markers of different retinal cell types. Importantly, the timing of the exit from the cell cycle is also crucial for normal retinal development, because the different classes of cell types are produced in distinct ratios. If too many cells exit the cell cycle during the early stage of development, then the proportion of early born cell types increases at the expense of that of late born cell types. (B) For example, the ratio of rods to horizontal cells in the mouse retina is approximately 140 : 1. (C) A differential interference contrast image of mouse retinal section showing the outer nuclear layer and the inner nuclear layer. gcl, ganglion cell layer; inl, inner nuclear layer; ipl, inner plexiform layer; onl, outer nuclear layer; opl, outer plexiform layer; os, outer segments.
Figure 8
Figure 8
Developmentally appropriate orthotopic retinoblastoma xenograft model. (A) Cultured retinoblastoma cells labelled with a green fluorescent protein (GFP) transgene were injected into the vitreous humour of newborn rats (1000 cells/eye). Two weeks later, the animals were treated with a chemotherapeutic drug, and three to six weeks later the effects were analysed by scoring the proportion of GFP positive cells in the vitreous humour. (B) The transplanted retinoblastoma cells are easily distinguished from the normal retinal cells by their green fluorescence. The red fluorescence is a nuclear counterstain.
Figure 9
Figure 9
Clonal retinoblastoma in the mouse retina after retroviral infection. (A) To inactivate all of the Rb family members in an individual retinal progenitor cell in vivo, we injected a retrovirus carrying the E1A oncogene and an alkaline phosphatase reporter gene into the eyes of newborn mice carrying a targeted deletion of the p53 tumour suppressor gene. The infected retinal progenitor cells gave rise to tumours after three weeks. This model will serve as a complement to the xenograft model described in fig 8. (B) To explore the developmental susceptibility of retinal progenitor cells to transformation, we used a novel transuterine injection procedure to target the retinae of embryonic day (E) 15.5 mouse embryos for retroviral infection. By comparing the incidence of tumour formation after infection at E15.5 with that after infection at postnatal day (P) 0, we hope to determine whether embryonic retinal progenitor cells are more or less susceptible to transformation.

Similar articles

Cited by

References

    1. Hahn WC, Weinberg RA. Modelling the molecular circuitry of cancer. Nat Rev Cancer 2002;2:331–41. - PubMed
    1. Brodeur GM. Neuroblastoma: biological insights into a clinical enigma. Nat Rev Cancer 2003;3:203–16. - PubMed
    1. Basch ML, Selleck MA, Bronner-Fraser M, et al. Timing and competence of neural crest formation. Dev Neurosci 2000;22:217–27. - PubMed
    1. Cepko CL, Austin CP, Yang X, et al. Cell fate determination in the vertebrate retina. Proc Natl Acad Sci U S A 1996;93:589–95. - PMC - PubMed
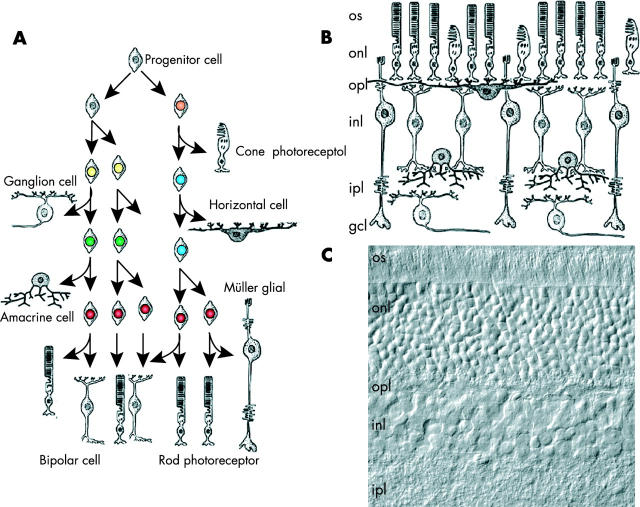
    1. Dyer MA, Cepko CL. Regulating proliferation during retinal development. Nat Rev Neurosci 2001;2:333–42. - PubMed