. 2004 Jun 18;304(5678):1811-4.
doi: 10.1126/science.1098641. Epub 2004 May 27.

Control of stochasticity in eukaryotic gene expression

Affiliations

Control of stochasticity in eukaryotic gene expression

Jonathan M Raser et al. Science. .

Abstract

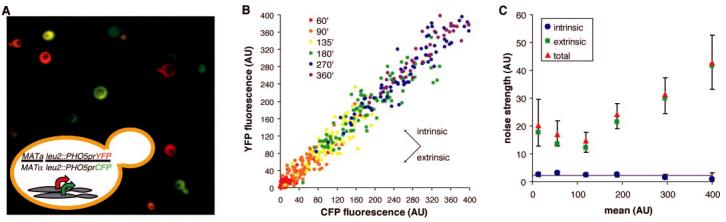
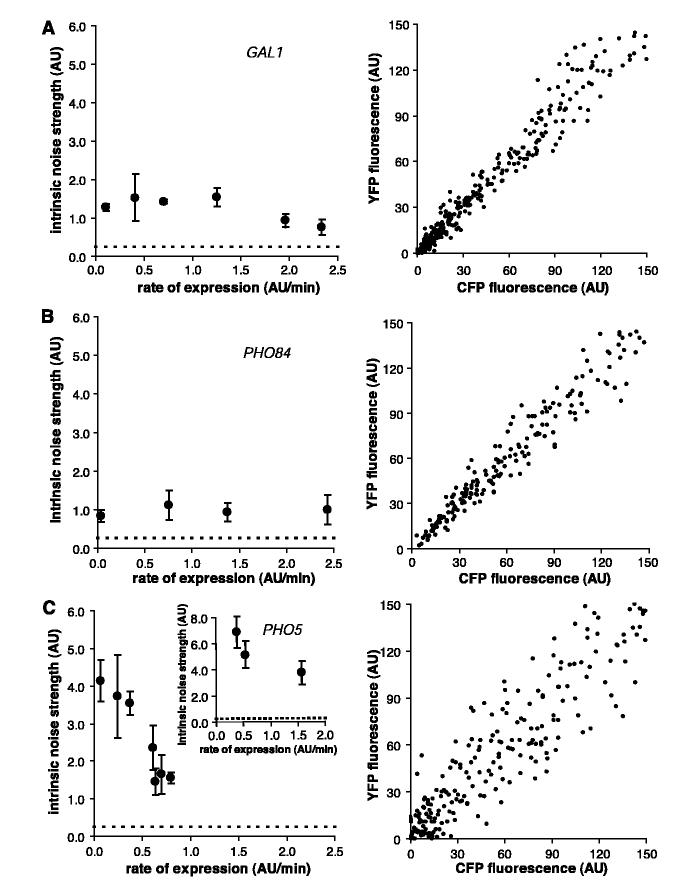
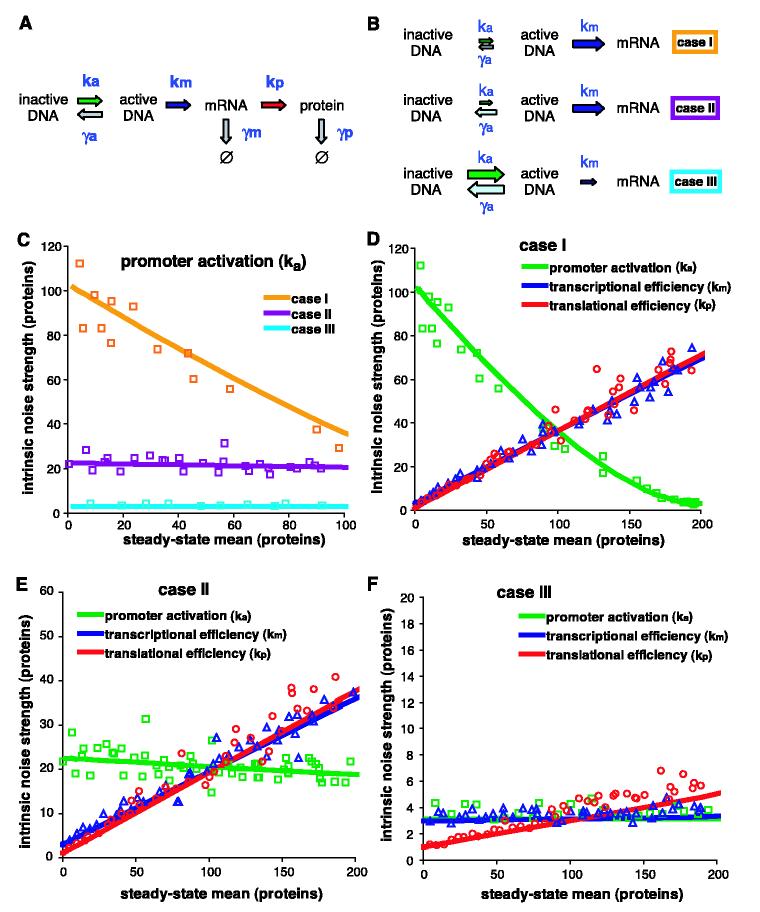
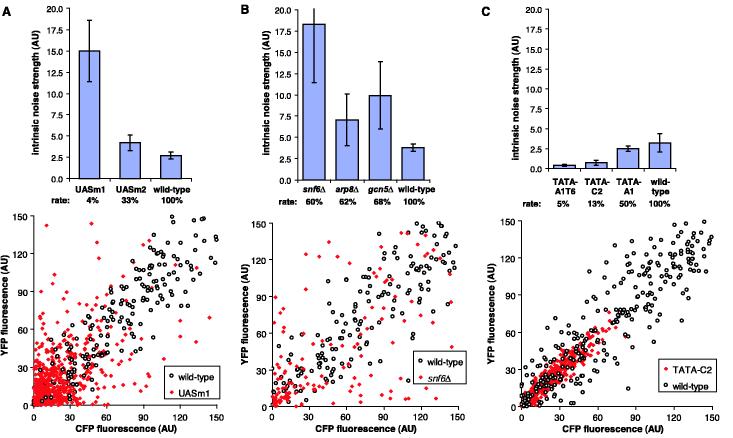
Noise, or random fluctuations, in gene expression may produce variability in cellular behavior. To measure the noise intrinsic to eukaryotic gene expression, we quantified the differences in expression of two alleles in a diploid cell. We found that such noise is gene-specific and not dependent on the regulatory pathway or absolute rate of expression. We propose a model in which the balance between promoter activation and transcription influences the variability in messenger RNA levels. To confirm the predictions of our model, we identified both cis- and trans-acting mutations that alter the noise of gene expression. These mutations suggest that noise is an evolvable trait that can be optimized to balance fidelity and diversity in eukaryotic gene expression.


Figures

Fig. 1
Fig. 1
Separation of intrinsic and extrinsic noise for the PHO5 promoter. (A) A false-color overlay of YFP (red) and CFP (green) fluorescence micrographs from a diploid yeast strain that expresses YFP and CFP from identical promoters at homologous loci, as diagrammed in the inset. (B) Scatter plots showing CFP and YFP values for each cell (solid circles) during a time course of PHO5 induction by phosphate starvation. Populations from different time points (in minutes) are indicated with different colors. Extrinsic noise is manifested as scatter along the diagonal and intrinsic noise as scatter perpendicular to the diagonal. AU, arbitrary units of fluorescence. (C) Total, extrinsic, and intrinsic noise strength as functions of population mean for (B). The solid line represents expectations for a single stochastic process, and error bars represent bootstrap values (6).
Fig. 2
Fig. 2
(A) Intrinsic noise strength as a function of rate of expression for GAL1 (left) and a scatter plot of GAL1-expressing cells at maximal induction (right). To produce different rates of expression, cells were induced with different galactose concentrations. (B) Intrinsic noise strength as a function of rate of expression for PHO84 and a scatter plot of PHO84-expressing cells at maximal induction. Cells were induced with different phosphate concentrations. (C) Intrinsic noise strength as a function of rate of expression for PHO5 and a scatter plot of PHO5-expressing cells at the maximal level of induction by phosphate starvation. Cells were induced with various levels of chemical inhibition of an upstream kinase (left) or with various organic phosphate concentrations (inset). The dashed line indicates the intrinsic error of measurement, and error bars represent standard deviations. Scatter plots contain cells from multiple time points.
Fig. 3
Fig. 3
General stochastic model of gene activation and expression. (A) Schematic of reactions with stochastic rate constants of production (k) and degradation (γ). Ø indicates the null product of degradation. a, active DNA; m, mRNA; p, protein. (B) Three cases, where the relative size of the arrows indicates the relative magnitude of the constants within each case. (C) The effect on intrinsic noise strength of changing the promoter activation rate to change the steady-state mean of expression for case I (orange □), case II (violet □), and case III (cyan □). (D to F) The effect on intrinsic noise strength of changing promoter activation (green □), transcriptional efficiency (red ○), and translational efficiency (purple △) to change the steady-state mean of expression for (D) case I, (E) case II, and (F) case III. For (C) to (F), the solid lines display the predicted values, and the open symbols are averages from stochastic simulations (6).
Fig. 4
Fig. 4
Mutational analysis of the PHO5 promoter. (A) Intrinsic noise strength and rate of expression of wild-type, UASm1, and UASm2 PHO5 promoter variants at maximal induction (top) and a scatter plot for the wild type (○) and UASm1 (red ◆) (bottom). The intrinsic noise of the UASm1 promoter is 77% at a mean of 26 AU, compared to 43% intrinsic noise at a mean of 29 AU for the wild-type promoter. (B) Intrinsic noise strength and rate of expression of the PHO5 promoter at maximal induction in the wild-type background or in strains that lack SNF6, ARP8, or GCN5 (top) and a scatter plot for the wild type (○) and snf6Δ (red ◆) (bottom). The intrinsic noise of the snf6Δ strain is 73% at a mean of 35 AU. (C) Intrinsic noise strength and rate of expression of wild-type and TATA mutant PHO5 promoters at maximal induction (top) and a scatter plot for the wild type (○) and TATA-C2 (red ◆) (bottom). The intrinsic noise of the TATA-C2 promoter is 15% at a mean of 25 AU. Error bars represent standard deviations. Scatter plots contain cells from multiple time points.

References

    1. McAdams HH, Arkin A. Trends Genet. 1999;15:65. - PubMed
    1. Schroedinger E. What Is Life? Cambridge Univ. Press; Cambridge: 1944.
    1. Rao CV, Wolf DM, Arkin AP. Nature. 2002;420:231. - PubMed
    1. Elowitz MB, Levine AJ, Siggia ED, Swain PS. Science. 2002;297:1183. - PubMed
    1. Swain PS, Elowitz MB, Siggia ED. Proc. Natl. Acad. Sci. U.S.A. 2002;99:12795. - PMC - PubMed

Publication types

MeSH terms