

Suppressor of cytokine signaling 1 (SOCS-1) and SOCS-3 cause insulin resistance through inhibition of tyrosine phosphorylation of insulin receptor substrate proteins by discrete mechanisms
- PMID: 15169905
- PMCID: PMC419873
- DOI: 10.1128/MCB.24.12.5434-5446.2004
Suppressor of cytokine signaling 1 (SOCS-1) and SOCS-3 cause insulin resistance through inhibition of tyrosine phosphorylation of insulin receptor substrate proteins by discrete mechanisms
Erratum in
- Mol Cell Biol. 2005 Oct;25(19):8762
Abstract
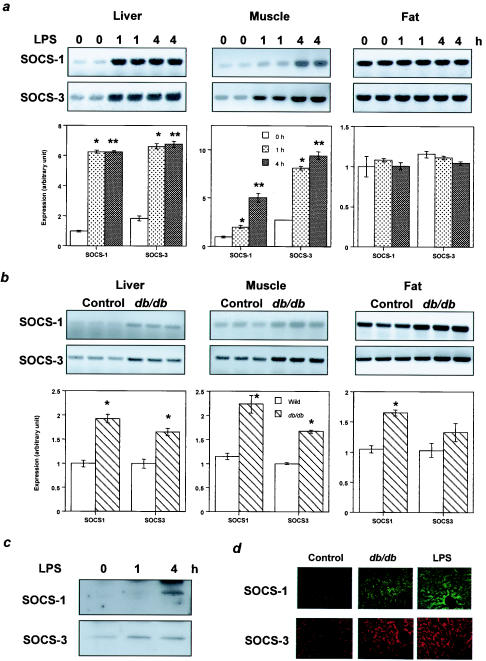
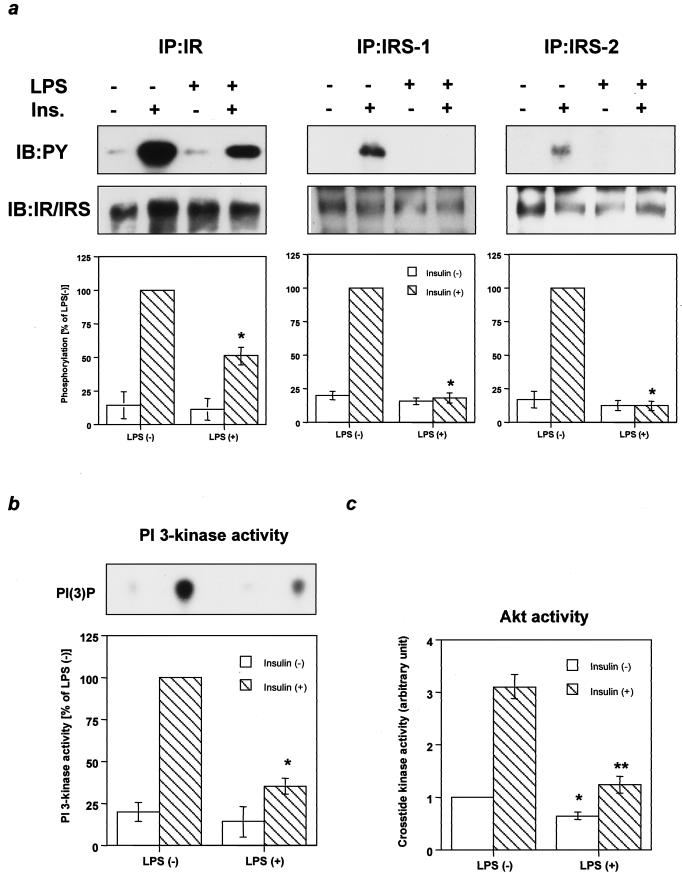
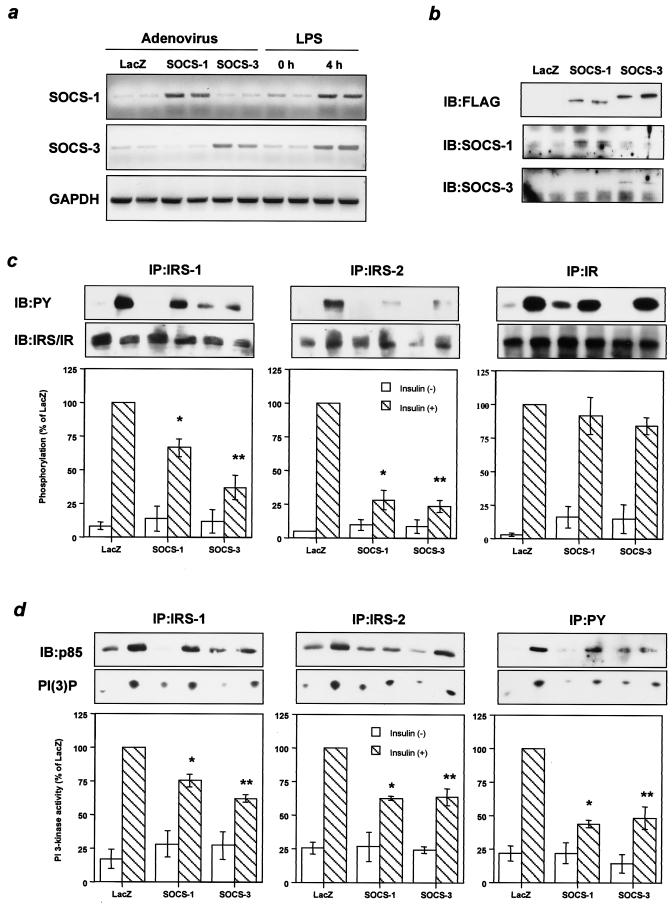
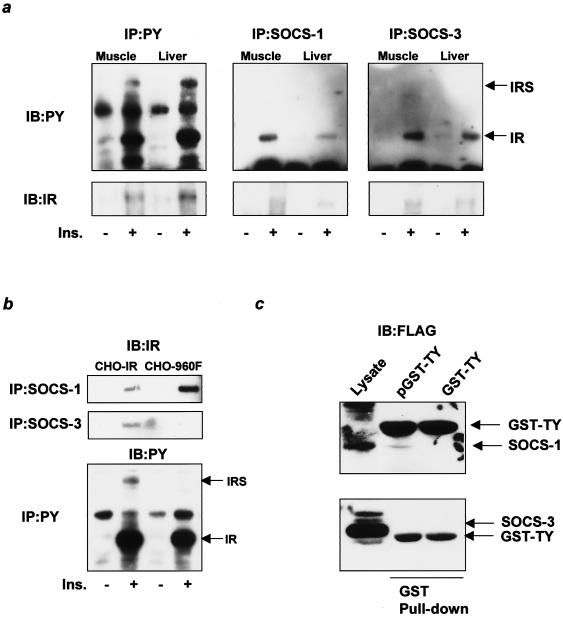
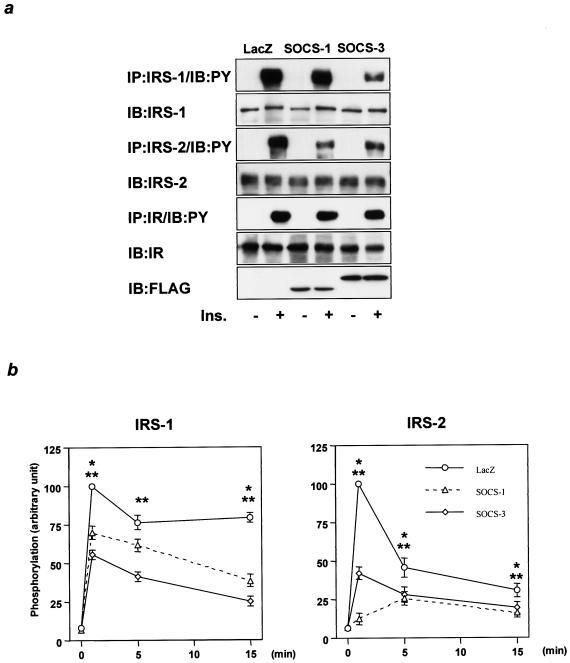
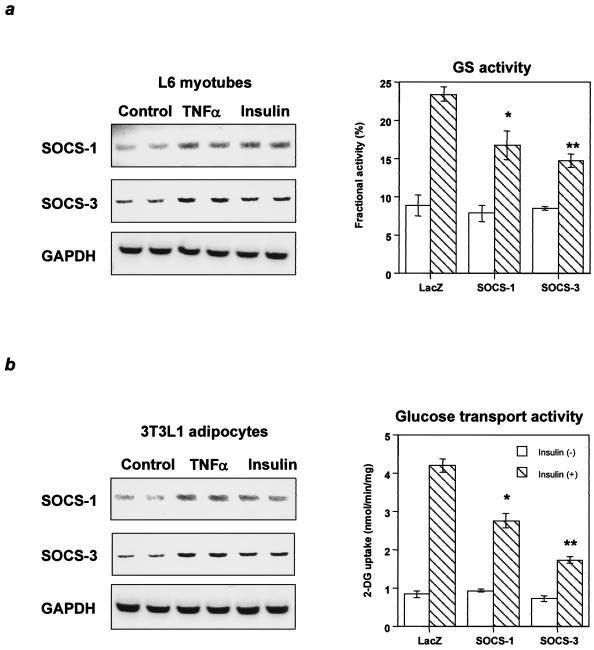
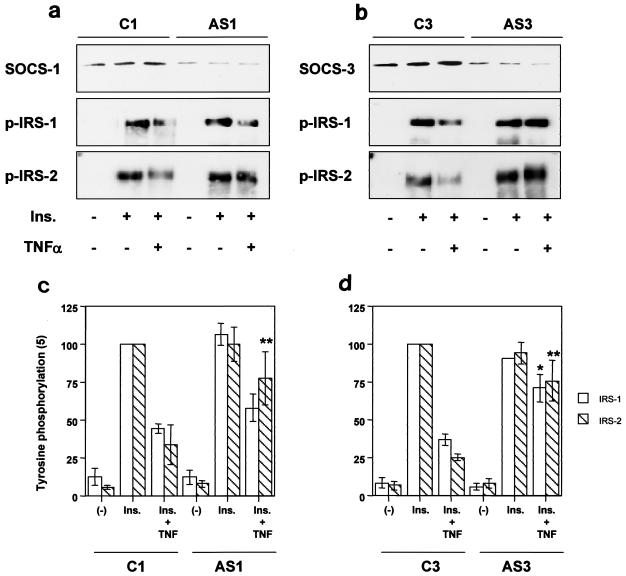
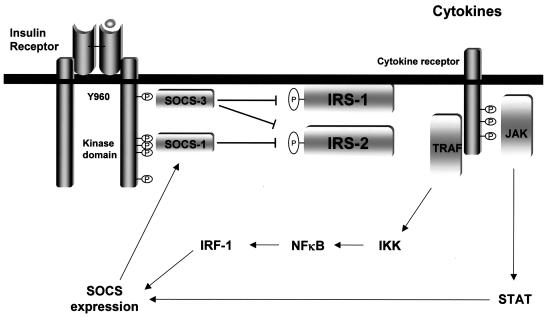
Insulin resistance is a pathophysiological component of type 2 diabetes and obesity and also occurs in states of stress, infection, and inflammation associated with an upregulation of cytokines. Here we show that in both obesity and lipopolysaccharide (LPS)-induced endotoxemia there is an increase in suppressor of cytokine signaling (SOCS) proteins, SOCS-1 and SOCS-3, in liver, muscle, and, to a lesser extent, fat. In concordance with these increases by LPS, tyrosine phosphorylation of the insulin receptor (IR) is partially impaired and phosphorylation of the insulin receptor substrate (IRS) proteins is almost completely suppressed. Direct overexpression of SOCS-3 in liver by adenoviral-mediated gene transfer markedly decreases tyrosine phosphorylation of both IRS-1 and IRS-2, while SOCS-1 overexpression preferentially inhibits IRS-2 phosphorylation. Neither affects IR phosphorylation, although both SOCS-1 and SOCS-3 bind to the insulin receptor in vivo in an insulin-dependent fashion. Experiments with cultured cells expressing mutant insulin receptors reveal that SOCS-3 binds to Tyr960 of IR, a key residue for the recognition of IRS-1 and IRS-2, whereas SOCS-1 binds to the domain in the catalytic loop essential for IRS-2 recognition in vitro. Moreover, overexpression of either SOCS-1 or SOCS-3 attenuates insulin-induced glycogen synthesis in L6 myotubes and activation of glucose uptake in 3T3L1 adipocytes. By contrast, a reduction of SOCS-1 or SOCS-3 by antisense treatment partially restores tumor necrosis factor alpha-induced downregulation of tyrosine phosphorylation of IRS proteins in 3T3L1 adipocytes. These data indicate that SOCS-1 and SOCS-3 act as negative regulators in insulin signaling and serve as one of the missing links between insulin resistance and cytokine signaling.
Figures
Similar articles
-
SOCS-3 is involved in the downregulation of the acute insulin-like effects of growth hormone in rat adipocytes by inhibition of Jak2/IRS-1 signaling.Horm Metab Res. 2003 Mar;35(3):169-77. doi: 10.1055/s-2003-39077. Horm Metab Res. 2003. PMID: 12734778
-
Suppressor of cytokine signaling-3 Provides a novel interface in the cross-talk between angiotensin II and insulin signaling systems.Endocrinology. 2005 Feb;146(2):579-88. doi: 10.1210/en.2004-0466. Epub 2004 Oct 28. Endocrinology. 2005. PMID: 15514089
-
SOCS-3 inhibits insulin signaling and is up-regulated in response to tumor necrosis factor-alpha in the adipose tissue of obese mice.J Biol Chem. 2001 Dec 21;276(51):47944-9. doi: 10.1074/jbc.M104602200. Epub 2001 Oct 16. J Biol Chem. 2001. PMID: 11604392
-
A new role for SOCS in insulin action. Suppressor of cytokine signaling.Sci STKE. 2003 Feb 11;2003(169):PE6. doi: 10.1126/stke.2003.169.pe6. Sci STKE. 2003. PMID: 12582200 Review.
-
SOCS proteins causing trouble in insulin action.Acta Physiol (Oxf). 2008 Jan;192(1):29-36. doi: 10.1111/j.1748-1716.2007.01782.x. Acta Physiol (Oxf). 2008. PMID: 18171427 Review.
Cited by
-
Cytoplasmic polyadenylation element binding protein deficiency stimulates PTEN and Stat3 mRNA translation and induces hepatic insulin resistance.PLoS Genet. 2012 Jan;8(1):e1002457. doi: 10.1371/journal.pgen.1002457. Epub 2012 Jan 12. PLoS Genet. 2012. PMID: 22253608 Free PMC article.
-
Overexpression of suppressor of cytokine signaling 3 in the arcuate nucleus of juvenile Phodopus sungorus alters seasonal body weight changes.J Comp Physiol B. 2013 Dec;183(8):1101-11. doi: 10.1007/s00360-013-0772-1. Epub 2013 Jul 17. J Comp Physiol B. 2013. PMID: 23860586
-
Hypoxia-inducible factor 1α regulates a SOCS3-STAT3-adiponectin signal transduction pathway in adipocytes.J Biol Chem. 2013 Feb 8;288(6):3844-57. doi: 10.1074/jbc.M112.426338. Epub 2012 Dec 19. J Biol Chem. 2013. PMID: 23255598 Free PMC article.
-
Lipocalin 13 regulation of glucose and lipid metabolism in obesity.Vitam Horm. 2013;91:369-83. doi: 10.1016/B978-0-12-407766-9.00015-8. Vitam Horm. 2013. PMID: 23374724 Free PMC article. Review.
-
Research progress into adipose tissue macrophages and insulin resistance.Physiol Res. 2023 Jul 14;72(3):287-299. doi: 10.33549/physiolres.935046. Physiol Res. 2023. PMID: 37449743 Free PMC article. Review.
References
-
- Aguirre, V., T. Uchida, L. Yenush, R. Davis, and M. F. White. 2000. The c-Jun NH(2)-terminal kinase promotes insulin resistance during association with insulin receptor substrate-1 and phosphorylation of Ser(307). J. Biol. Chem. 275:9047-9054. - PubMed
-
- Aguirre, V., E. D. Werner, J. Giraud, Y. H. Lee, S. E. Shoelson, and M. F. White. 2002. Phosphorylation of Ser307 in insulin receptor substrate-1 blocks interactions with the insulin receptor and inhibits insulin action. J. Biol. Chem. 277:1531-1537. - PubMed
-
- Barkai, U., A. Prigent-Tessier, C. Tessier, G. B. Gibori, and G. Gibori. 2000. Involvement of SOCS-1, the suppressor of cytokine signaling, in the prevention of prolactin-responsive gene expression in decidual cells. Mol. Endocrinol. 14:554-563. - PubMed
-
- Bruning, J. C., J. Winnay, S. Bonner-Weir, S. I. Taylor, D. Accili, and C. R. Kahn. 1997. Development of a novel polygenic model of NIDDM in mice heterozygous for IR and IRS-1 null alleles. Cell 88:561-572. - PubMed
-
- Butler, M., R. A. McKay, I. J. Popoff, W. A. Gaarde, D. Witchell, S. F. Murray, N. M. Dean, S. Bhanot, and B. P. Monia. 2002. Specific inhibition of PTEN expression reverses hyperglycemia in diabetic mice. Diabetes 51:1028-1034. - PubMed
Publication types
MeSH terms
Substances
Grants and funding
LinkOut - more resources
Full Text Sources
Other Literature Sources
Molecular Biology Databases
Research Materials