

In vitro release of vascular endothelial growth factor from gadolinium-doped biodegradable microspheres
- PMID: 15170848
- PMCID: PMC2396272
- DOI: 10.1002/mrm.20092
In vitro release of vascular endothelial growth factor from gadolinium-doped biodegradable microspheres
Abstract
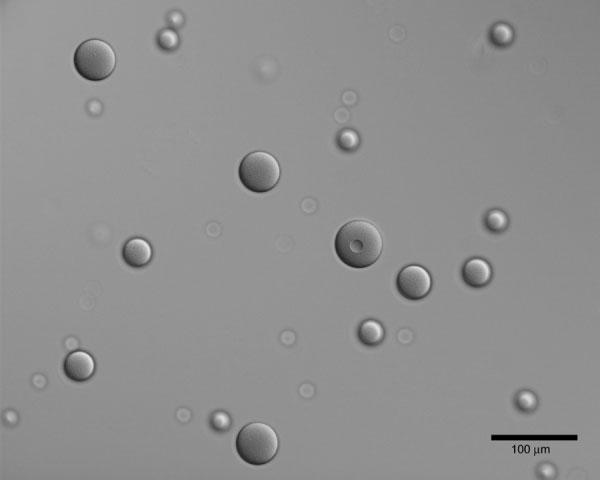
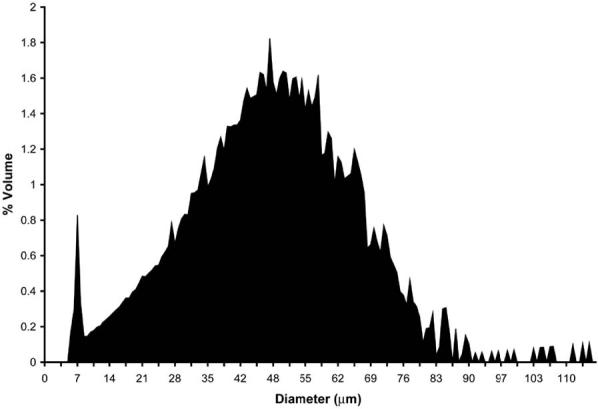
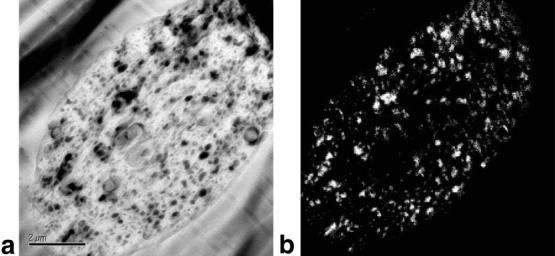
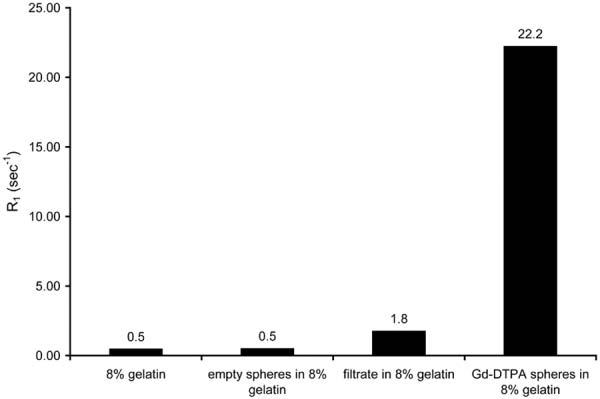
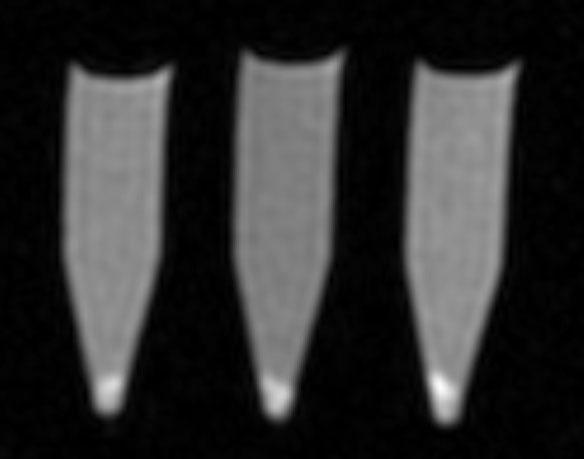
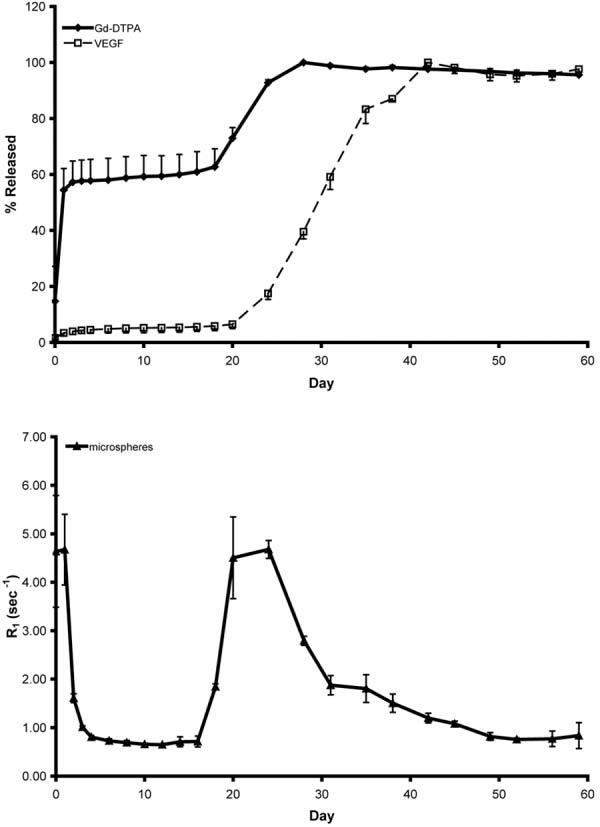
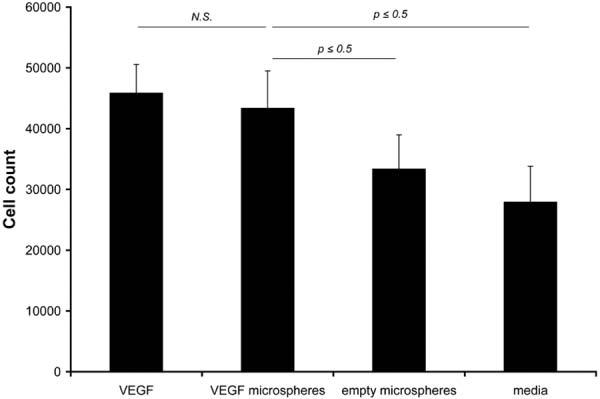
A drug delivery vehicle was constructed that could be visualized noninvasively with MRI. The biodegradable polymer poly(DL-lactic-co-glycolic acid) (PLGA) was used to fabricate microspheres containing vascular endothelial growth factor (VEGF) and the MRI contrast agent gadolinium diethylenetriamine pentaacetic acid (Gd-DTPA). The microspheres were characterized in terms of size, drug and contrast agent encapsulation, and degradation rate. The PLGA microspheres had a mean diameter of 48 +/- 18 microm. The gadolinium loading was 17 +/- 3 microg/mg polymer and the VEGF loading was 163 +/- 22 ng/mg polymer. Electron microscopy revealed that the Gd was dispersed throughout the microspheres and it was confirmed that the Gd loading was sufficient to visualize the microspheres under MRI. VEGF and Gd-DTPA were released from the microspheres in vitro over a period of approximately 6 weeks in three phases: a burst, followed by a slow steady-state, then a rapid steady-state. Biodegradable Gd-doped microspheres can be effectively used to deliver drugs in a sustained manner, while being monitored noninvasively with MRI.
Figures
Similar articles
-
Controlled release of vascular endothelial growth factor using poly-lactic-co-glycolic acid microspheres: in vitro characterization and application in polycaprolactone fumarate nerve conduits.Acta Biomater. 2012 Feb;8(2):511-8. doi: 10.1016/j.actbio.2011.10.001. Epub 2011 Oct 7. Acta Biomater. 2012. PMID: 22019759 Free PMC article.
-
Controlled delivery of the anti-VEGF aptamer EYE001 with poly(lactic-co-glycolic)acid microspheres.Invest Ophthalmol Vis Sci. 2003 Jan;44(1):290-9. doi: 10.1167/iovs.01-1156. Invest Ophthalmol Vis Sci. 2003. PMID: 12506087
-
Preparation and in vitro characterization of vascular endothelial growth factor (VEGF)-loaded poly(D,L-lactic-co-glycolic acid) microspheres using a double emulsion/solvent evaporation technique.J Microencapsul. 2011;28(1):46-54. doi: 10.3109/02652048.2010.523795. J Microencapsul. 2011. PMID: 21171816
-
Influence of the microencapsulation method and peptide loading on poly(lactic acid) and poly(lactic-co-glycolic acid) degradation during in vitro testing.J Control Release. 1998 Feb 12;51(2-3):327-41. doi: 10.1016/s0168-3659(97)00188-0. J Control Release. 1998. PMID: 9685930
-
A biomimetic approach to active self-microencapsulation of proteins in PLGA.J Control Release. 2014 Dec 28;196:60-70. doi: 10.1016/j.jconrel.2014.08.029. Epub 2014 Sep 8. J Control Release. 2014. PMID: 25219750 Free PMC article.
Cited by
-
Controlled release of vascular endothelial growth factor using poly-lactic-co-glycolic acid microspheres: in vitro characterization and application in polycaprolactone fumarate nerve conduits.Acta Biomater. 2012 Feb;8(2):511-8. doi: 10.1016/j.actbio.2011.10.001. Epub 2011 Oct 7. Acta Biomater. 2012. PMID: 22019759 Free PMC article.
-
In vivo molecular imaging of vascular stress.Cell Stress Chaperones. 2008 Sep;13(3):263-73. doi: 10.1007/s12192-008-0043-3. Epub 2008 May 9. Cell Stress Chaperones. 2008. PMID: 18465206 Free PMC article. Review.
-
Controlled delivery of VEGF via modulation of alginate microparticle ionic crosslinking.J Control Release. 2009 Feb 20;134(1):26-34. doi: 10.1016/j.jconrel.2008.10.019. Epub 2008 Nov 8. J Control Release. 2009. PMID: 19027807 Free PMC article.
-
Engineering of multifunctional gels integrating highly efficient growth factor delivery with endothelial cell transplantation.FASEB J. 2008 Aug;22(8):2949-56. doi: 10.1096/fj.08-108803. Epub 2008 May 1. FASEB J. 2008. PMID: 18450813 Free PMC article.
-
MR imaging of hydrogel filament embolic devices loaded with superparamagnetic iron oxide or gadolinium.Neuroradiology. 2011 Jun;53(6):449-56. doi: 10.1007/s00234-010-0744-z. Epub 2010 Jul 13. Neuroradiology. 2011. PMID: 20625708
References
-
- Cohen S, Yoshioka T, Lucarelli M, Hwang LH, Langer R. Controlled delivery systems for proteins based on poly(lactic/glycolic acid) microspheres. Pharm Res. 1991;8:713–720. - PubMed
-
- Athanasiou KA, Niederauer GG, Agrawal CM. Sterilization, toxicity, biocompatibility and clinical applications of polylactic acid/polyglycolic acid copolymers. Biomaterials. 1996;17:93–102. - PubMed
-
- Cleland JL, Mac A, Boyd B, Yang J, Duenas ET, Yeung D, Brooks D, Hsu C, Chu H, Mukku V, Jones AJ. The stability of recombinant human growth hormone in poly(lactic-co-glycolic acid) (PLGA) microspheres. Pharm Res. 1997;14:420–425. - PubMed
-
- Singh M, Shirley B, Bajwa K, Samara E, Hora M, O'Hagan D. Controlled release of recombinant insulin-like growth factor from a novel formulation of polylactide-co-glycolide microparticles. J Control Release. 2001;70:21–28. - PubMed
-
- King TW, Patrick CW., Jr Development and in vitro characterization of vascular endothelial growth factor (VEGF)-loaded poly(DL-lactic-coglycolic acid)/poly(ethylene glycol) microspheres using a solid encapsulation/single emulsion/solvent extraction technique. J Biomed Mater Res. 2000;51:383–390. - PubMed
MeSH terms
Substances
Grants and funding
LinkOut - more resources
Full Text Sources
Other Literature Sources
