Comparative Study
. 2004 Aug 15;382(Pt 1):279-91.
doi: 10.1042/BJ20031809.

A core catalytic domain of the TyrA protein family: arogenate dehydrogenase from Synechocystis

Affiliations
Comparative Study

A core catalytic domain of the TyrA protein family: arogenate dehydrogenase from Synechocystis

Carol A Bonner et al. Biochem J. .

Abstract

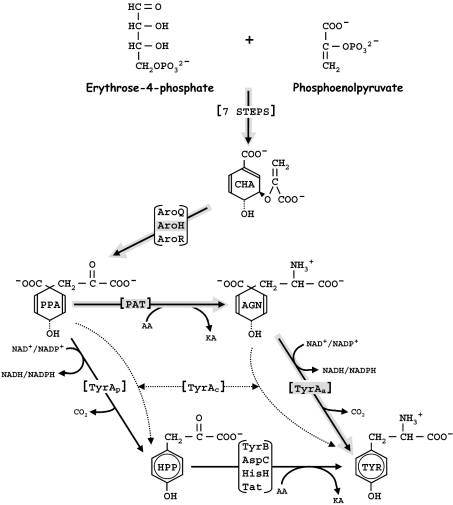
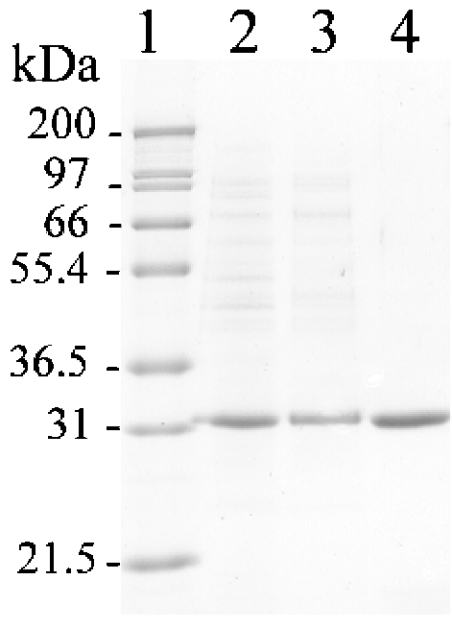
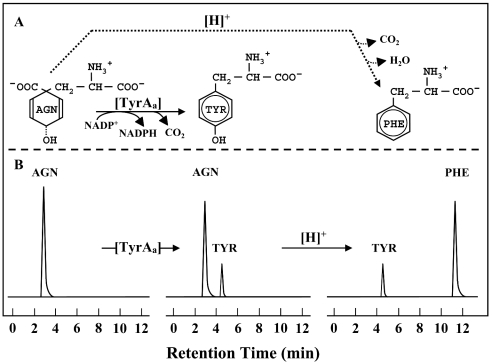
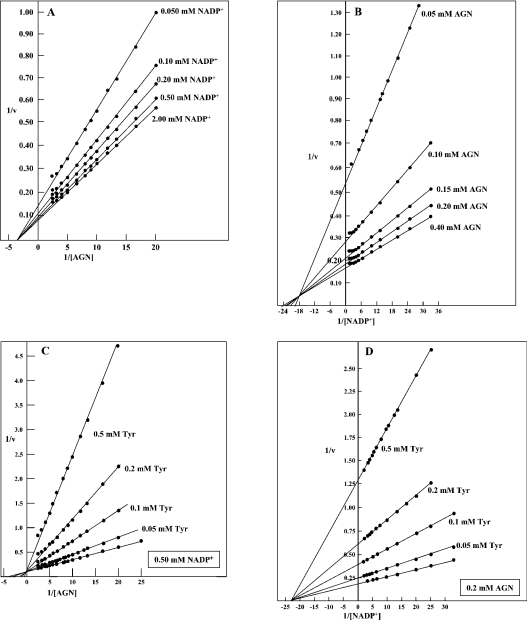
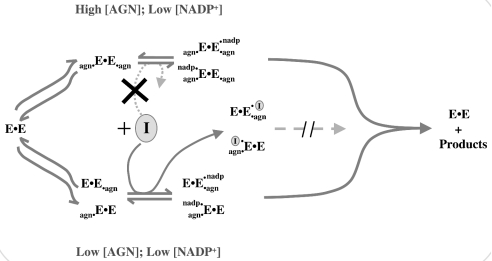
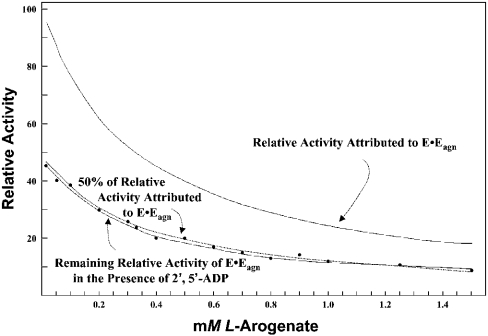
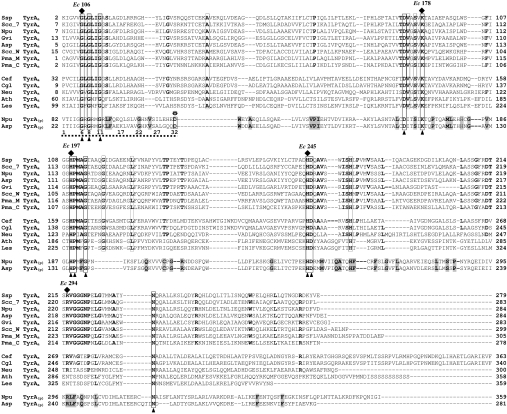
The TyrA protein family includes prephenate dehydrogenases, cyclohexadienyl dehydrogenases and TyrA(a)s (arogenate dehydrogenases). tyrA(a) from Synechocystis sp. PCC 6803, encoding a 30 kDa TyrA(a) protein, was cloned into an overexpression vector in Escherichia coli. TyrA(a) was then purified to apparent homogeneity and characterized. This protein is a model structure for a catalytic core domain in the TyrA superfamily, uncomplicated by allosteric or fused domains. Competitive inhibitors acting at the catalytic core of TyrA proteins are analogues of any accepted cyclohexadienyl substrate. The homodimeric enzyme was specific for L-arogenate (K(m)=331 microM) and NADP+ (K(m)=38 microM), being unable to substitute prephenate or NAD+ respectively. L-Tyrosine was a potent inhibitor of the enzyme (K(i)=70 microM). NADPH had no detectable ability to inhibit the reaction. Although the mechanism is probably steady-state random order, properties of 2',5'-ADP as an inhibitor suggest a high preference for L-arogenate binding first. Comparative enzymology established that both of the arogenate-pathway enzymes, prephenate aminotransferase and TyrA(a), were present in many diverse cyanobacteria and in a variety of eukaryotic red and green algae.


Figures

Figure 1
Figure 1. Composite of alternative biochemical routes to TYR in nature
Chorismate (CHA) is converted into prephenate (PPA) via chorismate mutase, which is represented in Nature by three homology groups (AroQ, AroH or AroR) [12]. PPA may be transaminated by prephenate aminotransferase (PAT) to yield AGN. TyrAa converts AGN into TYR. Alternatively, TyrAp converts PPA into 4-hydroxyphenylpyruvate (HPP) that is then transaminated to TYR via (depending on the organism) a homologue of either TyrB, AspC, HisH or Tat [58]. A broad-specificity cyclohexadienyl dehydrogenase (TyrAc) is competent to catalyse either the TyrAa or the TyrAp reaction (shown by dotted arrows). The Synechocystis sp. enzyme route to TYR is highlighted in grey. Other abbreviations: AA, amino-acid donor; KA, oxo-acid accepter.
Figure 2
Figure 2. Characterization of the purified recombinant TyrAa
SDS/PAGE (12% gel) of Synechocystis sp. PCC 6803 protein extracts from the E. coli transformant harbouring the overexpression construct, pET:tyrAa. Lane 1, molecular-mass standards; lane 2, crude extract of transformed cells (6 μg); lane 3, Mono-Q eluate (4 μg); lane 4, affinity-purified protein (4 μg). The purified enzyme displayed a molecular mass of approx. 33 kDa.
Figure 3
Figure 3. HPLC confirmation of TYR as the product of TyrAa
(A) Enzymic reaction catalysed by TyrAa: conversion of AGN and NADP+ to TYR, NADPH and CO2. The upper dotted-line portion of the schematic illustrates the acid ([H+])-catalysed conversion of AGN to PHE, carbon dioxide and water. (B) Reaction samples were analysed by C-18 reverse-phase HPLC as described in the Materials and methods section. At 0 min of elapsed reaction time (left), AGN in the sample eluted at a retention time of approx. 3.5 min. After 30 min of elapsed reaction time (middle), TYR was detected at its retention time of approx. 4.5 min. After acidification of the 30-min reaction mixture (right), AGN was completely converted into PHE, which eluted at a retention time of approx. 11.5 min. Retention times were identical with those obtained for pure standards of AGN, TYR and PHE.
Figure 4
Figure 4. Kinetic analysis of Synechocystis TyrAa
Double-reciprocal plots of initial velocities are shown when one substrate was held constant and the other substrate was varied (A, B) and when TYR was used as inhibitor (C, D). Slight inhibition was observed at very high concentrations of either substrate. (A) NADP+ was held constant at the five concentrations indicated, and AGN concentrations were varied from 0.05 to 0.40 mM. (B) AGN was held constant at the five designated concentrations and NADP+ was varied at concentrations from 0.03 to 0.5 mM. (C) Varied concentrations of AGN were used with NADP+ concentration fixed at 0.5 mM. Five data sets were obtained in the presence of the four designated TYR concentrations. (D) Different concentrations of NADP+ were used with AGN concentration fixed at 0.2 mM. Five data sets were obtained in the presence of the four designated TYR concentrations.
Figure 5
Figure 5. Model for productive catalytic species targeted for inhibition by 2′,5′-ADP
Assuming a strong preference for AGN binding first, the major productive homodimeric complexes present at high AGN concentration (upper pathway) or at low AGN concentration (lower pathway) are shown. If AGN binds first, then high AGN concentrations will eliminate most of the proposed target species (E•Eagn or agnE•E). The inhibitor (2′,5′-ADP) is shown in grey as an encircled ‘I’. A dotted line associated with a ‘cross’ or with an interruption of continuity indicates inability to bind or lack of activity respectively.
Figure 6
Figure 6. Correlation of fractional enzyme activity contributed by E•EAGN and sensitivity to 2′,5′-ADP
Abundance of enzyme dimers having one catalytic site occupied by AGN (E•Eagn) or both sites occupied by AGN (agnE•Eagn) was calculated as a function of AGN concentration. The fraction of total catalytic activity that can be attributed to the E•Eagn species was determined (top line). Sensitivity to inhibition by 0.5 mM 2′,5′-ADP was determined using 0.02 mM NADP+ and the indicated 15 variable concentrations of AGN. The activity inhibited was subtracted from the calculated relative activities of E•Eagn (top line) to yield data points that represent relative activity values of E•Eagn remaining in the presence of 2′,5′-ADP.
Figure 7
Figure 7. Multiple alignment for comparison of the two subgroups of cyanobacterial TyrA proteins
Organisms: Npu, Nostoc punctiforme; Asp, Anabaena species; Ssp, Synechocystis species; Scc_W and Scc_7, Synechococcus species (strains W8102 and 7002); Gvi, G. violaceus; Pma_M and Pma_C, P. marinus (strains MIT9313 and CCMP1378 MED4); Neu, N. europaea; Cef, C. efficiens; Cgl, C. glutamicum; Ath, Arabidopsis thaliana; Les, Lycopersicon esculentum. Members of the upper subgroup are TyrAa proteins (from cyanobacteria). The middle group includes additional known TyrAa proteins. The lower subgroup, consisting of two cyanobacterial sequences, clusters (results not shown) with the enteric TyrA(p) (‘prephenate dehydrogenase’) protein subgroup. Anchor residues that are invariant or near-invariant within the entire TyrA protein family are designated with upwardly pointed arrowheads. The aspartate residue of the Wierenga ‘fingerprint’ [34] that is critical for NAD+ binding (found only in the lower subgroup) is boxed and designated with an asterisk. The boldface dotted line in the early N-terminal region below the sequences covers the Wierenga ‘fingerprint’ region, with numbers shown allowing for a maximal variable-loop size of five. Gaps in this region of the alignment are within the variable loop. Conserved residues that are restricted to the TyrAa grouping of sequences (top and middle blocks) are boxed lightly. The grey-highlighted and boldface residues are those that are invariant or near-invariant within a large set of the enteric TyrA(p) protein subgroup. Residues that are invariant throughout the cyanobacterial TyrAa grouping, but not shared by all other TyrAa members, are shown in boldface. Residues marked at the top by black solid diamonds correspond to the amino-acid residue number of the E. coli (Ec) TyrA(p) protein.

Similar articles

Cited by

References

    1. Todd A. E., Orengo C. A., Thornton J. M. Evolution of function in protein superfamilies, from a structural perspective. J. Mol. Biol. 2001;307:1113–1143. - PubMed
    1. Teichmann S. A., Rison S. C. G., Thornton J. M., Riley M., Gough J., Clothia C. The evolution and structural anatomy of the small molecule metabolic pathways in Escherichia coli. J. Mol. Biol. 2001;311:693–708. - PubMed
    1. Stenmark S. L., Pierson D. L., Glover G. I., Jensen R. A. Blue–green bacteria synthesize L-tyrosine by the pretyrosine pathway. Nature (London) 1974;247:290–292. - PubMed
    1. Patel N., Pierson D. L., Jensen R. A. Dual enzymatic routes to L-tyrosine and L-phenylalanine via pretyrosine in Pseudomonas aeruginosa. J. Biol. Chem. 1977;252:5839–5846. - PubMed
    1. Zamir L. O., Jensen R. A., Arison B., Douglas A., Albers-Schonberg G., Bowen J. R. Structure of arogenate (pretyrosine), an amino acid intermediate of aromatic biosynthesis. J. Am. Chem. Soc. 1980;102:4499–4504.

Publication types

MeSH terms

Associated data

LinkOut - more resources