Comparative Study
. 2004 Jun 1;5(1):34.
doi: 10.1186/1471-2164-5-34.

Comprehensive analysis of the base composition around the transcription start site in Metazoa

Affiliations
Comparative Study

Comprehensive analysis of the base composition around the transcription start site in Metazoa

Stein Aerts et al. BMC Genomics. .

Abstract

Background: The transcription start site of a metazoan gene remains poorly understood, mostly because there is no clear signal present in all genes. Now that several sequenced metazoan genomes have been annotated, we have been able to compare the base composition around the transcription start site for all annotated genes across multiple genomes.

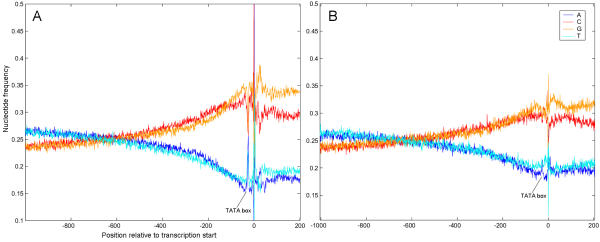
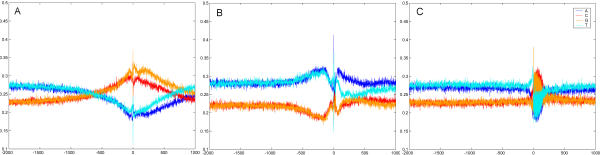
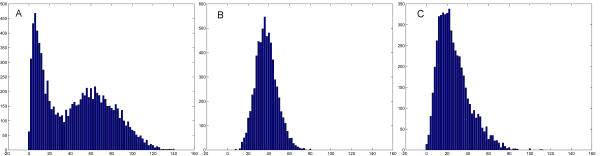
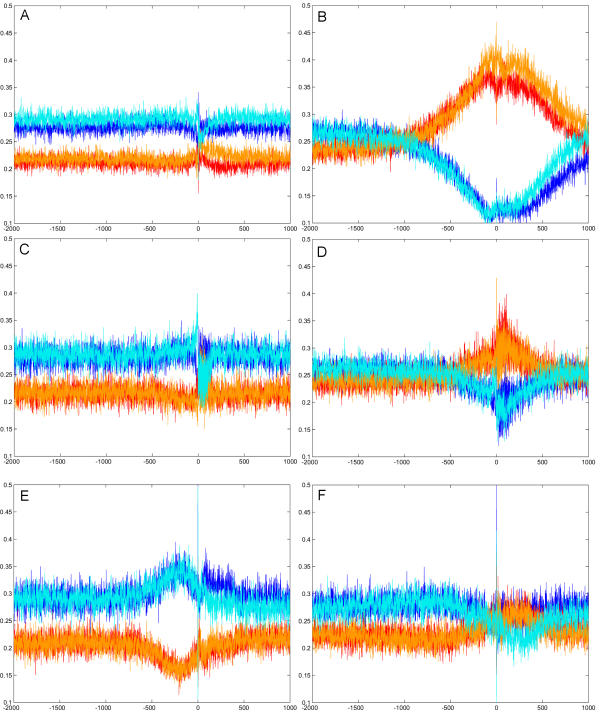
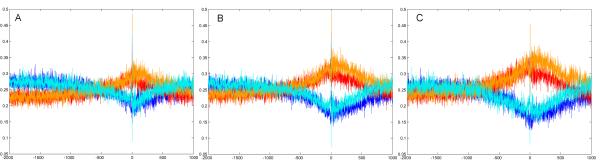
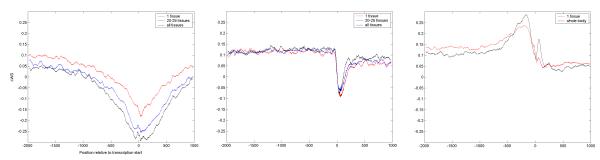
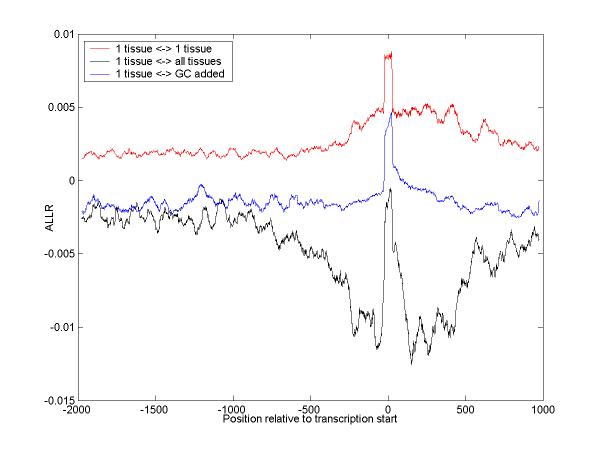
Results: The most prominent feature in the base compositions is a significant local variation in G+C content over a large region around the transcription start site. The change is present in all animal phyla but the extent of variation is different between distinct classes of vertebrates, and the shape of the variation is completely different between vertebrates and arthropods. Furthermore, the height of the variation correlates with CpG frequencies in vertebrates but not in invertebrates and it also correlates with gene expression, especially in mammals. We also detect GC and AT skews in all clades (where %G is not equal to %C or %A is not equal to %T respectively) but these occur in a more confined region around the transcription start site and in the coding region.

Conclusions: The dramatic changes in nucleotide composition in humans are a consequence of CpG nucleotide frequencies and of gene expression, the changes in Fugu could point to primordial CpG islands, and the changes in the fly are of a totally different kind and unrelated to dinucleotide frequencies.


Figures

Figure 1
Figure 1
Nucleotide frequencies around the experimentally determined transcription start site (A) and around the annotated gene start in Ensembl of all genes in DBTSS (A) and 5000 randomly selected genes from Ensembl (B).
Figure 2
Figure 2
Nucleotide frequencies around the annotated gene start in Ensembl, calculated from 5000 randomly selected genes in human (A), Drosophila (B), and Fugu (C).
Figure 3
Figure 3
Frequency distributions of the CpG dinucleotide in the [-400,400] region around the TSS in human (A), fly (B), and Fugu (C).
Figure 4
Figure 4
Nucleotide frequencies of several gene classes, separated according to the concentration of a dinucleotide in the [-400,400] region around the TSS. A. Human genes with few CpG doublets. B. Human genes with many CpG doublets. C. Fugu genes with few CpGs. D. Fugu genes with many CpGs. E. Fly genes with many ApTs. F. Fly genes with few ApTs.
Figure 5
Figure 5
Nucleotide frequencies of three human gene groups: genes with a narrow expression pattern (A), a medium pattern (B), and a wide pattern(C).
Figure 6
Figure 6
ΔWS profiles. ΔWS = [(A+T)-(G+C)]/(A+T+G+C) is plotted on the y axis, at each position x. (A) Differences between the ΔWS profiles for human gene groups with narrow, medium, and wide expression can be observed. The significance thereof is assessed (see text and Figure 7). (B) For the orthologous genes in Fugu, there are no observable differences. (C) For narrow and wide expression groups in Drosophila, only small differences are present.
Figure 7
Figure 7
ALLR (Average Log Likelihood Ratio) at each position along the aligned DNA sequences, comparing different distributions. For the red (upper) curve the two compared distributions are the same. The curve lies above zero. Around TSS, the ALLR increases due to a higher similarity with the background profile (5000 random genes). The blue (middle) curve again represents the ALLR values comparing the "1 tissue" expression group with itself, but now the G+C content of one distribution was artificially increased to test the effect caused by GC isochores. The black curve (bottom) compares the "1 tissue" with the "all tissues" expression groups. It represents two effects: one of the GC isochores (where it coincides with the blue curve), and one of the CpG island effect (where it deviates from the blue curve around TSS).

References

    1. Bernardi G. The human genome: organization and evolutionary history. Annu Rev Genet. 1995;29:445–476. doi: 10.1146/annurev.ge.29.120195.002305. - DOI - PubMed
    1. Bird AP. CpG-rich islands and the function of DNA methylation. Nature. 1986;321:209–213. - PubMed
    1. Green P, Ewing B, Miller W, Thomas P, Green E. Transcription-associated mutational asymmetry in mammalian evolution. Nat Genet. 2003;33:514–517. doi: 10.1038/ng1103. - DOI - PubMed
    1. Eyre-Walker A. Evidence of selection on silent site base composition in mammals: potential implications for the evolution of isochores and junk DNA. Genetics. 1999;152:675–683. - PMC - PubMed
    1. Frank AC, Lobry JR. Asymmetric substitution patterns: a review of possible underlying mutational or selective mechanisms. Gene. 1999;238:65–77. doi: 10.1016/S0378-1119(99)00297-8. - DOI - PubMed

Publication types

MeSH terms

LinkOut - more resources