

Automatic identification of subcellular phenotypes on human cell arrays
- PMID: 15173118
- PMCID: PMC419791
- DOI: 10.1101/gr.2383804
Automatic identification of subcellular phenotypes on human cell arrays
Abstract
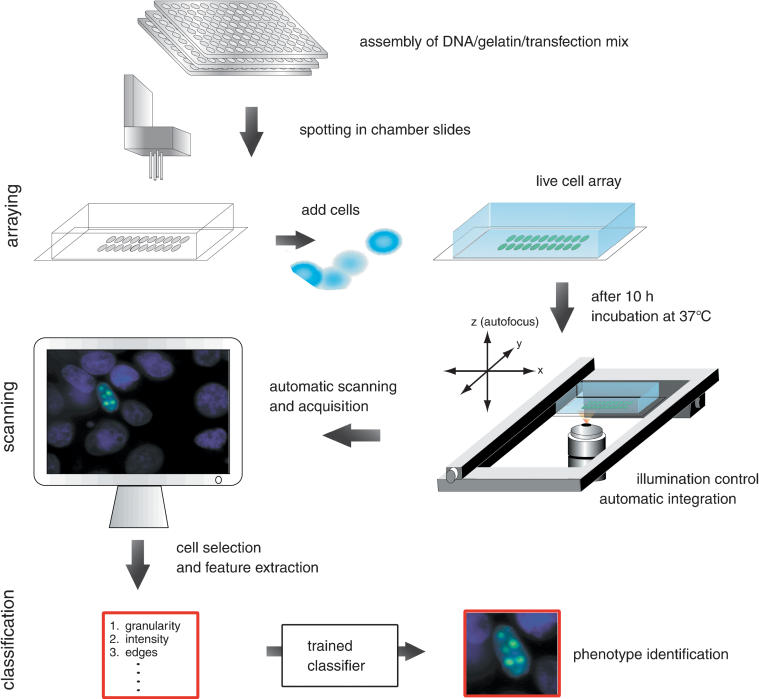
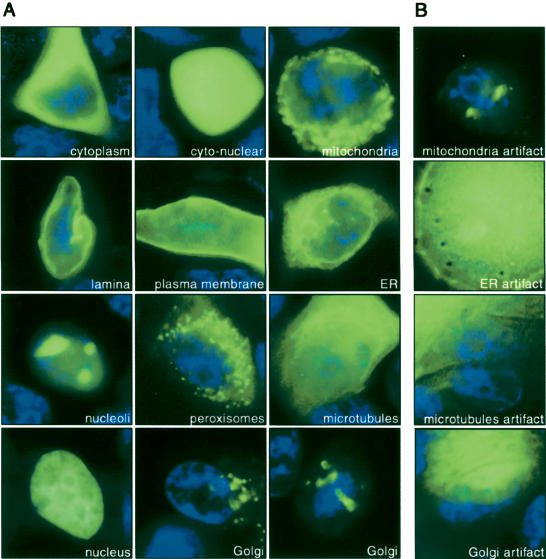
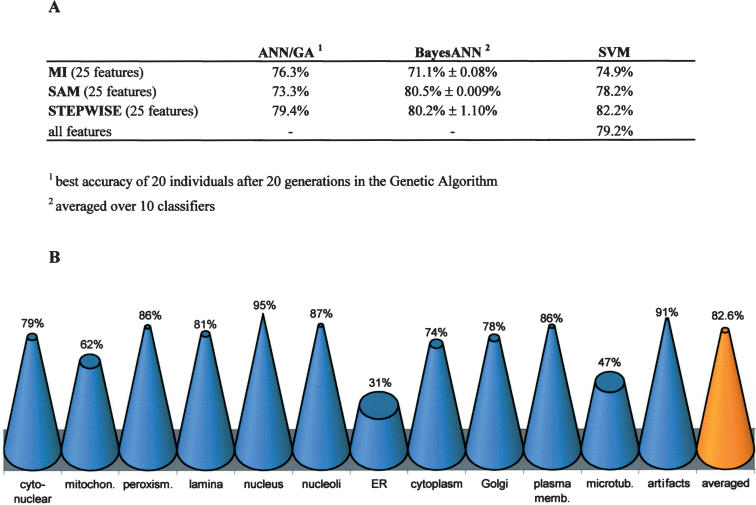
Light microscopic analysis of cell morphology provides a high-content readout of cell function and protein localization. Cell arrays and microwell transfection assays on cultured cells have made cell phenotype analysis accessible to high-throughput experiments. Both the localization of each protein in the proteome and the effect of RNAi knock-down of individual genes on cell morphology can be assayed by manual inspection of microscopic images. However, the use of morphological readouts for functional genomics requires fast and automatic identification of complex cellular phenotypes. Here, we present a fully automated platform for high-throughput cell phenotype screening combining human live cell arrays, screening microscopy, and machine-learning-based classification methods. Efficiency of this platform is demonstrated by classification of eleven subcellular patterns marked by GFP-tagged proteins. Our classification method can be adapted to virtually any microscopic assay based on cell morphology, opening a wide range of applications including large-scale RNAi screening in human cells.
Copyright 2004 Cold Spring Harbor Laboratory Press
Figures
Similar articles
-
RNAi microarray analysis in cultured mammalian cells.Genome Res. 2003 Oct;13(10):2341-7. doi: 10.1101/gr.1478703. Genome Res. 2003. PMID: 14525932 Free PMC article.
-
Quantitative analysis of highly parallel transfection in cell microarrays.Nucleic Acids Res. 2004 May 21;32(9):e77. doi: 10.1093/nar/gnh074. Nucleic Acids Res. 2004. PMID: 15155824 Free PMC article.
-
High-throughput selection of effective RNAi probes for gene silencing.Genome Res. 2003 Oct;13(10):2333-40. doi: 10.1101/gr.1575003. Genome Res. 2003. PMID: 14525931 Free PMC article.
-
[Molecular classification of breast cancers].Zhonghua Zhong Liu Za Zhi. 2008 Sep;30(9):641-3. Zhonghua Zhong Liu Za Zhi. 2008. PMID: 19173901 Review. Chinese. No abstract available.
-
Expression genomics in breast cancer research: microarrays at the crossroads of biology and medicine.Breast Cancer Res. 2007;9(2):206. doi: 10.1186/bcr1662. Breast Cancer Res. 2007. PMID: 17397520 Free PMC article. Review.
Cited by
-
Single object profiles regression analysis (SOPRA): a novel method for analyzing high-content cell-based screens.BMC Bioinformatics. 2022 Oct 21;23(1):440. doi: 10.1186/s12859-022-04981-8. BMC Bioinformatics. 2022. PMID: 36271357 Free PMC article.
-
Image classification of human carcinoma cells using complex wavelet-based covariance descriptors.PLoS One. 2013;8(1):e52807. doi: 10.1371/journal.pone.0052807. Epub 2013 Jan 16. PLoS One. 2013. PMID: 23341908 Free PMC article.
-
Mining and integration of pathway diagrams from imaging data.Bioinformatics. 2012 Mar 1;28(5):739-42. doi: 10.1093/bioinformatics/bts018. Epub 2012 Jan 20. Bioinformatics. 2012. PMID: 22267504 Free PMC article.
-
Phenotypic profiling of the human genome reveals gene products involved in plasma membrane targeting of SRC kinases.Genome Res. 2011 Nov;21(11):1955-68. doi: 10.1101/gr.116087.110. Epub 2011 Jul 27. Genome Res. 2011. PMID: 21795383 Free PMC article.
-
A reference library for assigning protein subcellular localizations by image-based machine learning.J Cell Biol. 2020 Mar 2;219(3):e201904090. doi: 10.1083/jcb.201904090. J Cell Biol. 2020. PMID: 31968357 Free PMC article.
References
-
- Bishop, C.M. 2000. Neural network for pattern recognition. Oxford University Press, New York.
-
- Bulinski, J.C., Odde, D.J., Howell, B.J., Salmon, T.D., and Waterman-Storer, C.M. 2001. Rapid dynamics of the microtubule binding of ensconsin in vivo. J. Cell. Sci. 114: 3885–3897. - PubMed
-
- Burhardt, H. and Siggelow, S. 2001. Invariant features in pattern recognition—fundamentals and application. In Nonlinear model-based image/video processing and analysis (eds. C. Kotropoulos and I. Pitas), pp. 269–307. John Wiley & Sons, New York.
-
- Chang, T. and Kuo, C.C. 1993. Texture analysis and classification with tree-structured wavelet transform. IEEE Transactions on Image Processing 2: 429–441. - PubMed
-
- Chen, X., Velliste, M., Weinstein, S., Jarvik, J.W., and Murphy, R.F. 2003. Location proteomics—Building subcellular location tree from high resolution 3D fluorescence microcope images of randomly-tagged proteins. Manipulation and Analysis of Biomolecules, Cells, and Tissues, Proceedings of SPIE 4962: 298–306.
WEB SITE REFERENCES
-
- http://www.dkfz.de/LIFEdb/; cDNA database.
-
- http://harvester.embl.de/; Database cross linker.
-
- http://www.csie.ntu.edu.tw/∼cjlin/libsvm/; Support Vector Machine implementation.
-
- http://www.ncrg.aston.ac.uk/netlab/; Neural Network toolbox using Matlab.
-
- http://brain.unr.edu; Source code of ANN (NevProp3) by Philip Goodman.
Publication types
MeSH terms
Substances
LinkOut - more resources
Full Text Sources
Other Literature Sources
Medical