

DNA mapping using microfluidic stretching and single-molecule detection of fluorescent site-specific tags
- PMID: 15173119
- PMCID: PMC419792
- DOI: 10.1101/gr.1635204
DNA mapping using microfluidic stretching and single-molecule detection of fluorescent site-specific tags
Abstract
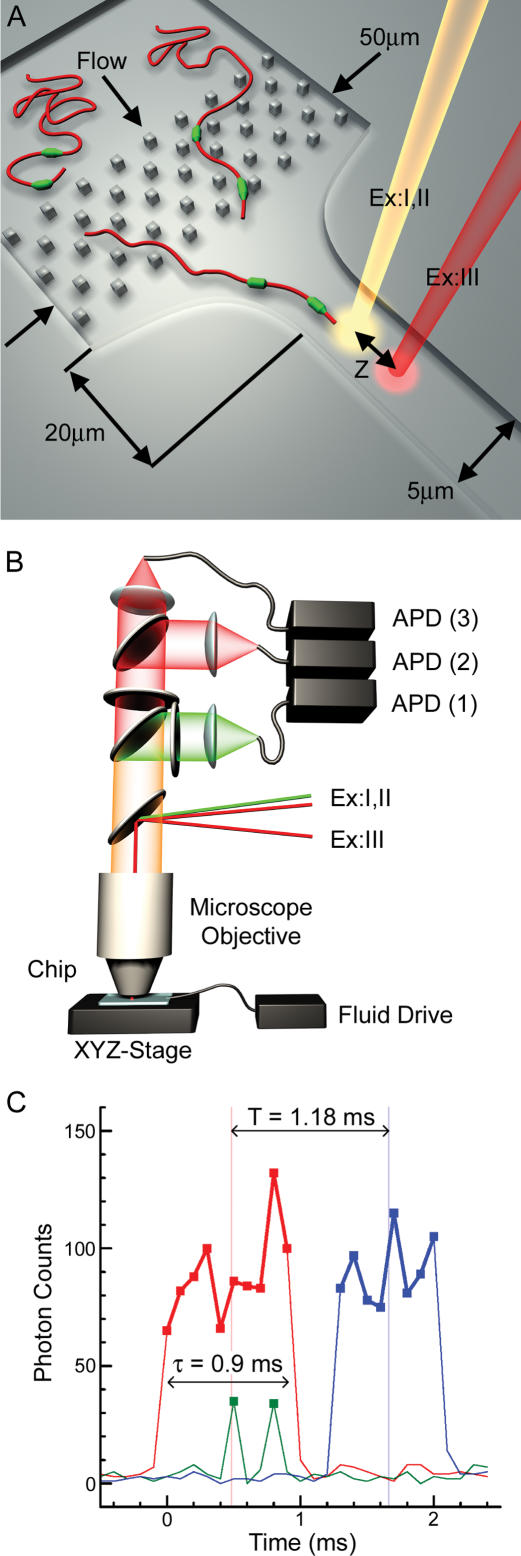
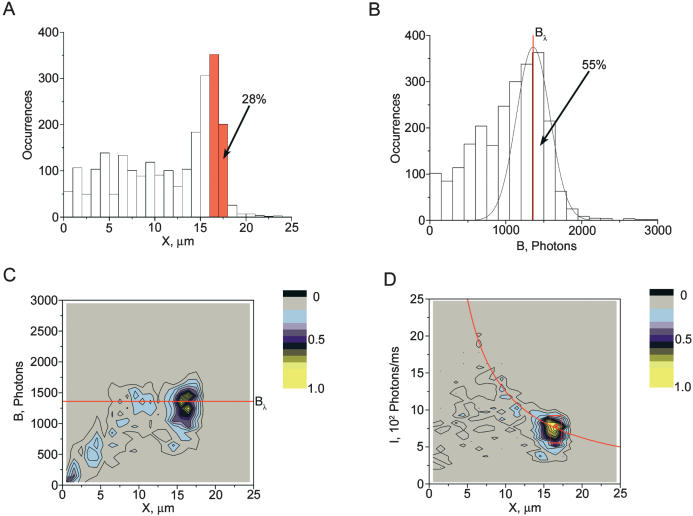
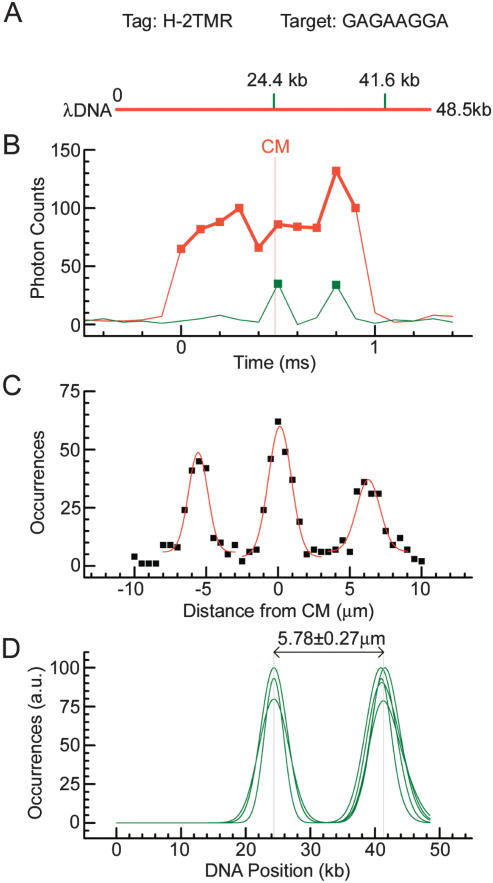
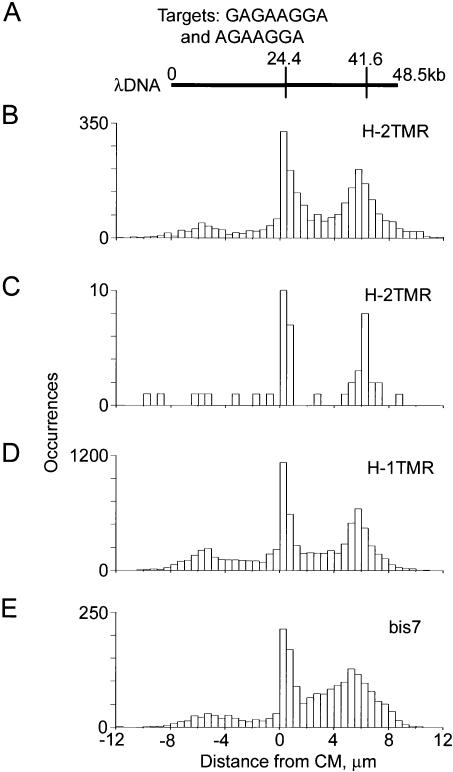
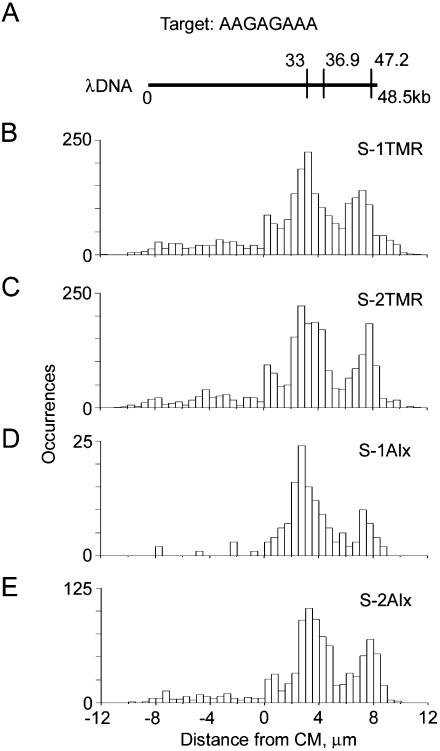
We have developed a rapid molecular mapping technology--Direct Linear Analysis (DLA)--on the basis of the analysis of individual DNA molecules bound with sequence-specific fluorescent tags. The apparatus includes a microfluidic device for stretching DNA molecules in elongational flow that is coupled to a multicolor detection system capable of single-fluorophore sensitivity. Double-stranded DNA molecules were tagged at sequence-specific motif sites with fluorescent bisPNA (Peptide Nucleic Acid) tags. The DNA molecules were then stretched in the microfluidic device and driven in a flow stream past confocal fluorescence detectors. DLA provided the spatial locations of multiple specific sequence motifs along individual DNA molecules, and thousands of individual molecules could be analyzed per minute. We validated this technology using the 48.5 kb lambda phage genome with different 8-base and 7-base sequence motif tags. The distance between the sequence motifs was determined with an accuracy of +/-0.8 kb, and these tags could be localized on the DNA with an accuracy of +/-2 kb. Thus, DLA is a rapid mapping technology, suitable for analysis of long DNA molecules.
Copyright 2004 Cold Spring Harbor Laboratory Press
Figures
Similar articles
-
Single DNA molecule stretching in sudden mixed shear and elongational microflows.Lab Chip. 2006 Sep;6(9):1187-99. doi: 10.1039/b602845d. Epub 2006 Jul 7. Lab Chip. 2006. PMID: 16929398
-
Application of single molecule technology to rapidly map long DNA and study the conformation of stretched DNA.Nucleic Acids Res. 2005 Oct 20;33(18):5829-37. doi: 10.1093/nar/gki895. Print 2005. Nucleic Acids Res. 2005. PMID: 16243782 Free PMC article.
-
FIT probes: peptide nucleic acid probes with a fluorescent base surrogate enable real-time DNA quantification and single nucleotide polymorphism discovery.Anal Biochem. 2008 Apr 15;375(2):318-30. doi: 10.1016/j.ab.2008.01.009. Epub 2008 Jan 12. Anal Biochem. 2008. PMID: 18249184
-
Measurement of telomere length using PNA probe by cytometry.Methods Cell Biol. 2011;103:189-202. doi: 10.1016/B978-0-12-385493-3.00008-5. Methods Cell Biol. 2011. PMID: 21722804 Review.
-
Hybridization analysis of DNA blots.Curr Protoc Immunol. 2001 May;Chapter 10:Unit 10.6B. doi: 10.1002/0471142735.im1006bs06. Curr Protoc Immunol. 2001. PMID: 18432698 Review.
Cited by
-
Electrical DNA Sequence Mapping Using Oligodeoxynucleotide Labels and Nanopores.ACS Nano. 2021 Feb 23;15(2):2679-2685. doi: 10.1021/acsnano.0c07947. Epub 2021 Jan 21. ACS Nano. 2021. PMID: 33478224 Free PMC article.
-
Peptide nucleic acids as tools for single-molecule sequence detection and manipulation.Nano Lett. 2010 Nov 10;10(11):4697-701. doi: 10.1021/nl102986v. Nano Lett. 2010. PMID: 20923183 Free PMC article.
-
Beyond gel electrophoresis: microfluidic separations, fluorescence burst analysis, and DNA stretching.Chem Rev. 2013 Apr 10;113(4):2584-667. doi: 10.1021/cr3002142. Epub 2012 Nov 12. Chem Rev. 2013. PMID: 23140825 Free PMC article. Review. No abstract available.
-
A simple DNA stretching method for fluorescence imaging of single DNA molecules.Nucleic Acids Res. 2006;34(17):e113. doi: 10.1093/nar/gkl593. Epub 2006 Sep 13. Nucleic Acids Res. 2006. PMID: 16971459 Free PMC article.
-
Entropic unfolding of DNA molecules in nanofluidic channels.Nano Lett. 2008 Nov;8(11):3839-44. doi: 10.1021/nl802256s. Epub 2008 Oct 10. Nano Lett. 2008. PMID: 18844427 Free PMC article.
References
-
- Aston, C., Hiort, C., and Schwartz, D.C. 1999a. Optical mapping: An approach for fine mapping. Methods Enzymol. 303: 55–73. - PubMed
-
- Aston, C., Mishra, B., and Schwartz, D.C. 1999b. Optical mapping and its potential for large-scale sequencing projects. Trends Biotech. 17: 297–302. - PubMed
-
- Birren, B. and Lai, E. 1993. Pulsed field gel electrophoresis: A practical guide. Academic Press, Inc., San Diego, CA.
-
- Braasch, D.A. and Corey, D.R. 2001. Locked nucleic acid (LNA): Fine-tuning the recognition of DNA and RNA. Chem. Biol. 8: 1–7. - PubMed
Publication types
MeSH terms
Substances
LinkOut - more resources
Full Text Sources
Other Literature Sources
Miscellaneous