. 2004 Jun 7;199(11):1491-502.
doi: 10.1084/jem.20040382. Epub 2004 Jun 1.

Negative regulation of immunoglobulin E-dependent allergic responses by Lyn kinase

Affiliations

Negative regulation of immunoglobulin E-dependent allergic responses by Lyn kinase

Sandra Odom et al. J Exp Med. .

Abstract

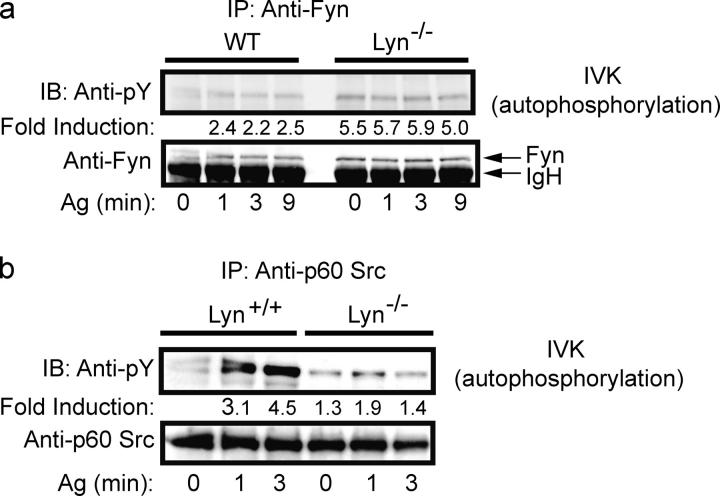
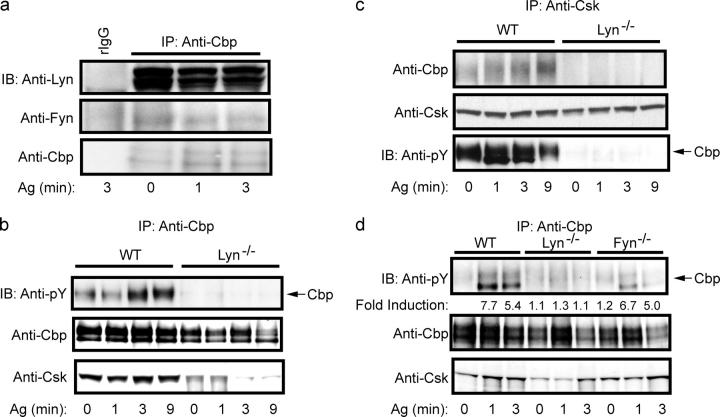
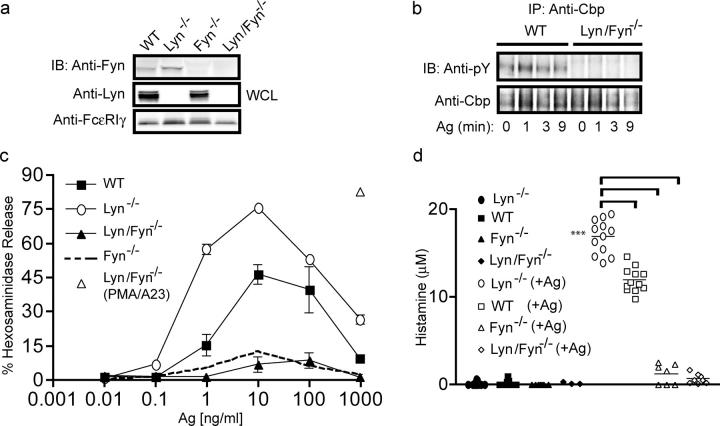
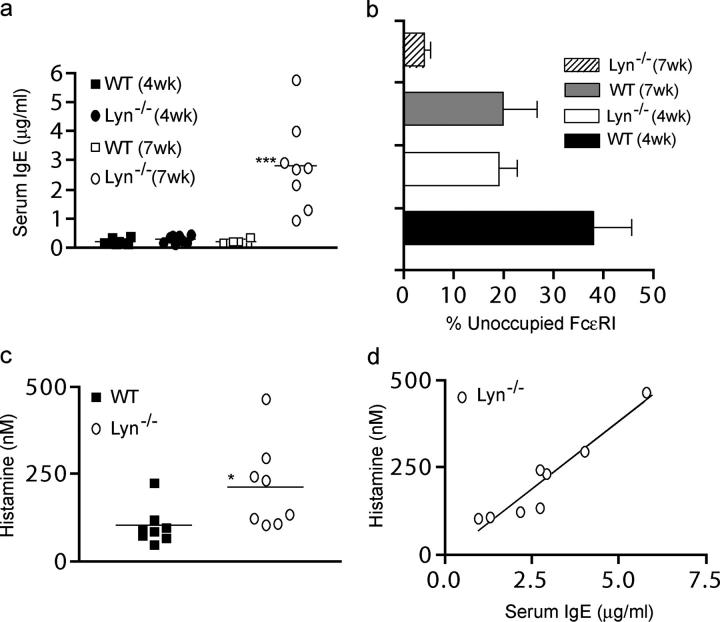
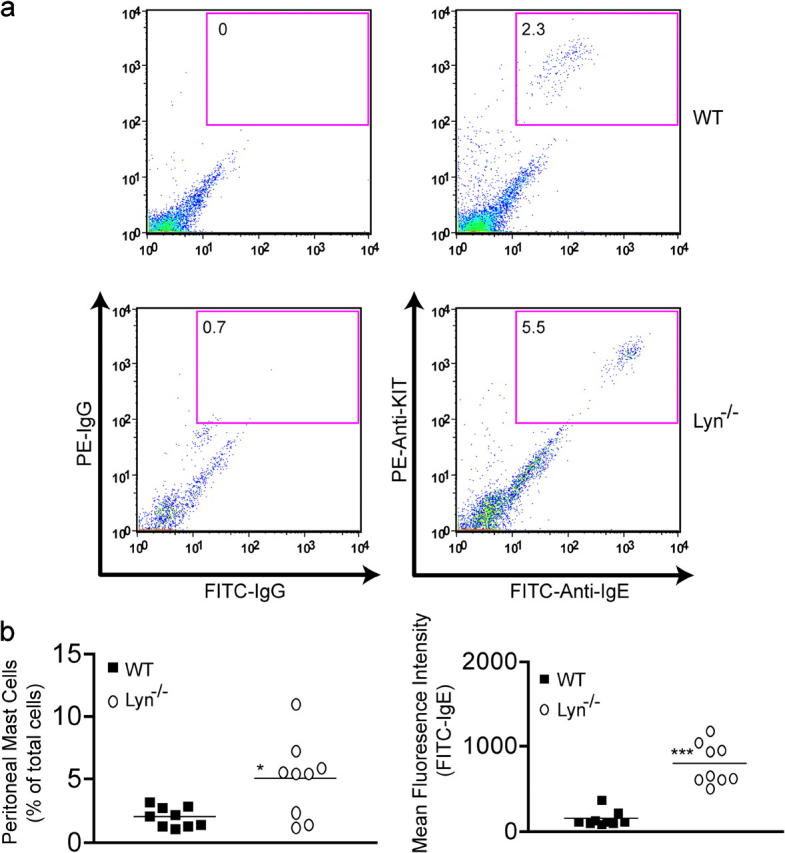
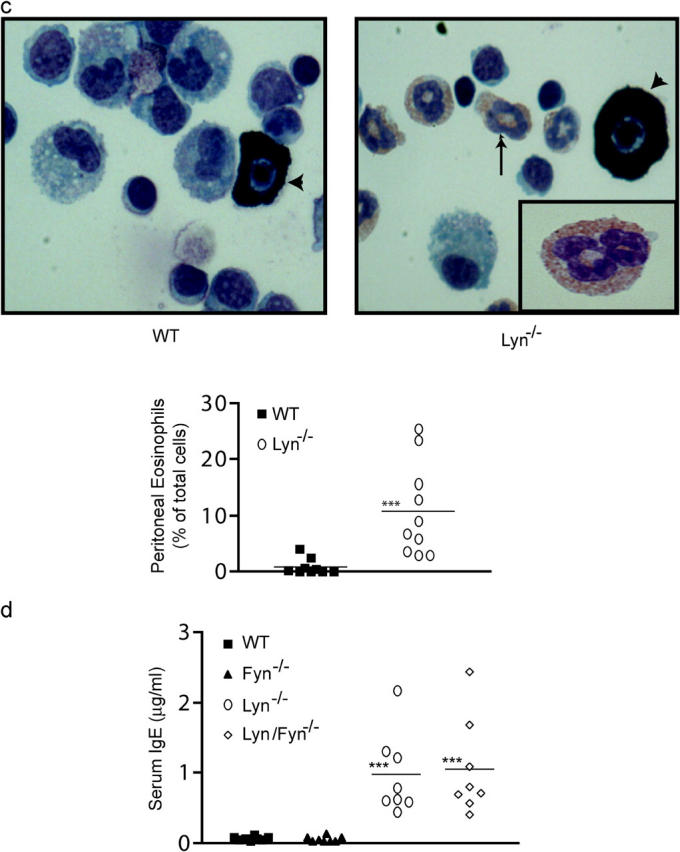
A role for Lyn kinase as a positive regulator of immunoglobulin (Ig)E-dependent allergy has long been accepted. Contrary to this belief, Lyn kinase was found to have an important role as a negative regulator of the allergic response. This became apparent from the hyperresponsive degranulation of lyn-/- bone marrow-derived mast cells, which is driven by hyperactivation of Fyn kinase that occurs, in part, through the loss of negative regulation by COOH-terminal Src kinase (Csk) and the adaptor, Csk-binding protein. This phenotype is recapitulated in vivo as young lyn-/- mice showed an enhanced anaphylactic response. In vivo studies also demonstrated that as lyn-/- mice aged, their serum IgE increased as well as occupancy of the high affinity IgE receptor (FcepsilonRI). This was mirrored by increased circulating histamine, increased mast cell numbers, increased cell surface expression of the high affinity IgE receptor (FcepsilonRI), and eosinophilia. The increased IgE production was not a consequence of increased Fyn kinase activity in lyn-/- mice because both lyn-/- and lyn-/- fyn-/- mice showed high IgE levels. Thus, lyn-/- mice and mast cells thereof show multiple allergy-associated traits, causing reconsideration of the possible efficacy in therapeutic targeting of Lyn in allergic disease.


Figures

Figure 1.
Figure 1.
Fyn kinase, but not Src kinase, activity is constitutively increased in Lyn−/− mast cells. (a) Wild-type or Lyn−/− mast cells were stimulated with Ag for the indicated time. Fyn kinase was immunoprecipitated and subjected to an IVK reaction. Autophosphorylation was measured by anti-phosphotyrosine (Anti-pY) immunoblotting and normalized for protein loading (Anti-Fyn). (b) Conditions were identical to (a), however, p60 Src was immunoprecipitated and subjected to IVK. Quantitation was by densitometry. One representative experiment is shown. Fold induction is the mean of three experiments normalized to the wild-type (0 min) activity.
Figure 2.
Figure 2.
Lyn kinase, but not Fyn kinase, is required for tyrosine phosphorylation of Cbp. (a) Wild-type mast cells were stimulated with Ag for the indicated time. Cbp was immunoprecipitated and recovered protein was probed for the presence of Lyn (Anti-Lyn) or Fyn (Anti-Fyn) kinases. A control immunoprecipitation with normal rabbit IgG (rIgG) is also shown. Immunoblots were reprobed with anti-Cbp for protein loading. (b) Wild-type and Lyn−/− mast cells were stimulated as described above for the indicated time. Cbp was immunoprecipitated and resolved proteins were probed for tyrosine phosphorylation (Anti-pY) or for Csk (Anti-Csk). (c) Cells were stimulated as described above and Csk was immunoprecipitated. Resolved protein was immunoblotted for Cbp phosphorylation, Csk, or Cbp protein. (d) Wild-type, Lyn−/−, or Fyn−/− mast cells were stimulated with Ag for the indicated time. Cbp was immunoprecipitated and its tyrosine phosphorylation was determined by anti-pY blotting. Stripped immunoblots were then reprobed with anti-Csk or anti-Cbp. Fold induction is the mean of three individual experiments from two BMMC cultures. For all panels, one representative of a minimum of three experiments is shown.
Figure 3.
Figure 3.
Control of Fyn kinase activity and mast cell degranulation is restored by retroviral transduction of Lyn kinase in Lyn-deficient mast cells. (a) Lyn−/− mast cells were transduced (reconstituted) with wild-type Lyn kinase (Lynre/re) or with a control vector (Lynve/ve). Expression of Lyn and Fyn kinase was compared between wild-type, Lyn−/−, Lynre/re, and Lynve/ve mast cells. Expression of endogenous Akt is shown for normalization. (b) Wild-type, Lyn−/−, Lynre/re, and Lynve/ve mast cells were stimulated with Ag for the indicated time. Fyn kinase was immunoprecipitated and subjected to an IVK assay. Autophosphorylation was detected by anti-pY and stripped blots were reprobed with anti-Fyn. One representative of three experiments is shown. Fold induction is the mean of all experiments. (c) Degranulation of wild-type Lyn-containing (Lynre/re), control vector–containing (Lynve/ve), Lyn−/−, and wild-type mast cells in response to the indicated Ag concentrations. Net hexosaminidase release is reported as a percentage of total. Data is from three individual experiments.
Figure 4.
Figure 4.
In vitro and in vivo degranulation of wild-type and Lyn-deficient mast cells is Fyn kinase dependent. (a) Doubly deficient lyn / fyn / mice were generated by initial mating of lyn / and fyn / mice. Whole cell lysates (WCL) from BMMCs derived from all genotypes were immunoblotted for Fyn, Lyn, and FcεRIγ (protein loading). (b) Wild-type and Lyn/Fyn−/− deficient mast cells were stimulated with Ag for the indicated time. Cbp was immunoprecipitated and its tyrosine phosphorylation was determined by anti-pY. Stripped blots were reprobed with anti-Cbp. (c) Degranulation of wild-type, Lyn−/−, Lyn/Fyn−/−, and Fyn−/− mast cells was determined, after stimulation with the indicated concentrations of Ag, by hexosaminidase release. Net release as a percentage of total cellular hexosaminidase is shown. PMA/A23187 stimulation of Lyn/Fyn−/− mast cells shows that these cells have no intrinsic defect in the secretory apparatus. (d) In vivo passive systemic anaphylactic challenge of 4-wk-old wt, lyn / , fyn / , and lyn / fyn / mice. Mice were passively sensitized with DNP-specific IgE (i.v.) and challenged 24 h later with DNP-HSA (Ag) or pseudochallenged with an equal volume of saline for 1.5 min (i.v.). Plasma histamine concentration was measured by competitive ELISA. Significance for all data was determined by an unpaired t test. ***, a p-value of ≤0.006.
Figure 5.
Figure 5.
Lyn −/− mice show increased serum IgE, increased FcεRI occupancy, and increased circulating histamine. (a) The serum IgE of 4- or 7-wk-old age- and sex-matched unchallenged wt or lyn / mice was measured by ELISA. (b) FcεRI occupancy of peritoneal mast cells was determined from 4- or 7-wk-old wt and lyn / mice. The mean fluorescence intensity of cells before and after incubation with exogenous IgE was compared with obtained relative occupancies. Data is shown as a percentage of receptors available for binding of exogenous IgE. (c) Plasma histamine concentration of the mice in (a) was measured by competitive ELISA. (d) Correlation analysis of serum IgE and histamine concentrations from lyn / mice (data in a and c). Significance for all data was determined by an unpaired t test. ***, a p-value of ≤0.003; *, a p-value of ≤0.03. Pearson r2 = 0.9517 for (d). A total of five (b) or eight (a and c) mice were used.
Figure 6.
Figure 6.
Lyn −/− mice have increased numbers of peritoneal mast cells with increased cell surface FcεRI expression and eosinophilia. Fyn is not required for increased serum IgE. (a) Cells from a peritoneal lavage of wt or lyn / mice were stained with antibody to KIT and IgE after incubation with IgE to ensure FcεRI saturation. As a negative control, isotype-specific IgG was also used to stain the cells. Inset numbers reflect the percentage of KIT/FcεRI+ cells. (b) The percentage of mast cells in the peritoneum and the mean fluorescence intensity of FITC-IgE staining (reflecting mast cell FcεRI expression) of all the mice analyzed (n = 10). (c) Wright-Giemsa stain of peritoneal lavage cells from wt or lyn / mice. Mast cells are indicated by intense granule staining (dark cells, marked with arrow head), whereas eosinophils show a light red/pink stain and multilobed/segmented nucleus (arrow, see inset in lyn / sample). Graph is a quantitation of the percentage of eosinophils found in the peritoneal lavage of all wt and lyn / mice analyzed (n = 10). (d) The serum IgE concentration of the indicated genotypes was measured by ELISA from eight sex- and age-matched mice as described in Materials and Methods. Mean of the observed IgE concentrations for lyn / or lyn / fyn / mice is indicated by the line. No significant difference was found between these two populations, but both were significantly different from wt or fyn / mice. Significance was determined by an unpaired t test. ***, a p-value of ≤0.006; *, a p-value of ≤0.03.
Figure 6.
Figure 6.
Lyn −/− mice have increased numbers of peritoneal mast cells with increased cell surface FcεRI expression and eosinophilia. Fyn is not required for increased serum IgE. (a) Cells from a peritoneal lavage of wt or lyn / mice were stained with antibody to KIT and IgE after incubation with IgE to ensure FcεRI saturation. As a negative control, isotype-specific IgG was also used to stain the cells. Inset numbers reflect the percentage of KIT/FcεRI+ cells. (b) The percentage of mast cells in the peritoneum and the mean fluorescence intensity of FITC-IgE staining (reflecting mast cell FcεRI expression) of all the mice analyzed (n = 10). (c) Wright-Giemsa stain of peritoneal lavage cells from wt or lyn / mice. Mast cells are indicated by intense granule staining (dark cells, marked with arrow head), whereas eosinophils show a light red/pink stain and multilobed/segmented nucleus (arrow, see inset in lyn / sample). Graph is a quantitation of the percentage of eosinophils found in the peritoneal lavage of all wt and lyn / mice analyzed (n = 10). (d) The serum IgE concentration of the indicated genotypes was measured by ELISA from eight sex- and age-matched mice as described in Materials and Methods. Mean of the observed IgE concentrations for lyn / or lyn / fyn / mice is indicated by the line. No significant difference was found between these two populations, but both were significantly different from wt or fyn / mice. Significance was determined by an unpaired t test. ***, a p-value of ≤0.006; *, a p-value of ≤0.03.

Similar articles

Cited by

References

    1. Pribluda, V.S., C. Pribluda, and H. Metzger. 1994. Transphosphorylation as the mechanism by which the high-affinity receptor for IgE is phosphorylated upon aggregation. Proc. Natl. Acad. Sci. USA. 91:11246–11250. - PMC - PubMed
    1. Field, K.A., D. Holowka, and B. Baird. 1997. Compartmentalized activation of the high affinity immunoglobulin E receptor within membrane domains. J. Biol. Chem. 272:4276–4280. - PubMed
    1. Rivera, J. 2002. Molecular adapters in FcɛRI signaling and the allergic response. Curr. Opin. Immunol. 14:688–693. - PubMed
    1. Nadler, M.J., S.A. Matthews, H. Turner, and J.-P. Kinet. 2000. Signal transduction by the high-affinity immunoglobulin E receptor Fc epsilon RI: coupling form to function. Adv. Immunol. 76:325–355. - PubMed
    1. Chan, V.W.F., F. Meng, P. Soriano, A.L. DeFranco, and C.A. Lowell. 1997. Characterization of the B lymphocyte populations in Lyn-deficient mice and the role of Lyn in signal initiation and down-regulation. Immunity. 7:69–81. - PubMed

Publication types