. 2004 Jun 8;101(23):8780-5.
doi: 10.1073/pnas.0401316101. Epub 2004 Jun 1.

Bilayers merge even when exocytosis is transient

Affiliations

Bilayers merge even when exocytosis is transient

Justin W Taraska et al. Proc Natl Acad Sci U S A. .

Abstract

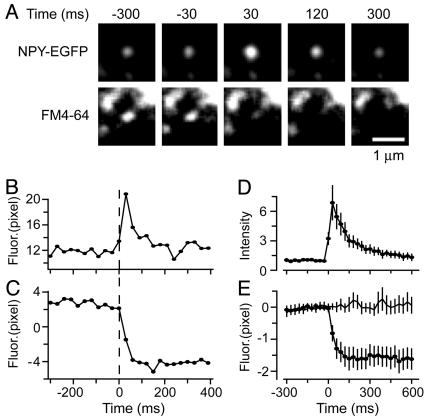
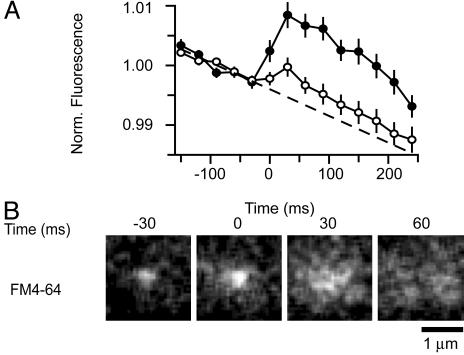
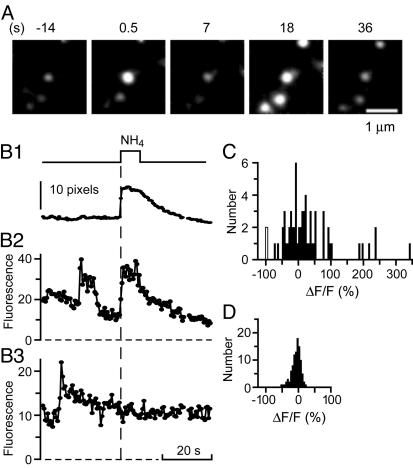
During exocytosis, the lumen of secretory vesicles connects with the extracellular space. In some vesicles, this connection closes again, causing the vesicle to be recaptured mostly intact. The degree to which the bilayers of such vesicles mix with the plasma membrane is unknown. Work supporting the kiss-and-run model of transient exocytosis implies that synaptic vesicles allow neither lipid nor protein to escape into the plasma membrane, suggesting that the two bilayers never merge. Here, we test whether neuroendocrine granules behave similarly. Using two-color evanescent field microscopy, we imaged the lipid probe FM4-64 and fluorescent proteins in single dense core granules. During exocytosis, granules lost FM4-64 into the plasma membrane in small fractions of a second. Although FM4-64 was lost, granules retained the membrane protein, GFP-phogrin. By using GFP-phogrin as a probe for resealing, it was found that even granules that reseal lose FM4-64. We conclude that the lipid bilayers of the granule and the plasma membrane become continuous even when exocytosis is transient.


Figures

Fig. 1.
Fig. 1.
Secretory granules accumulate the styryl dye FM4-64. (A) Evanescent field images of a PC12 cell transfected with NPY-EGFP (Left) and loaded with FM4-64 (Center); a merged image appears on the Right.(B) Magnified images of the regions marked with white boxes in A.(C Left) Square regions (1.5 × 1.5 μm) centered on single NPY-EGFP-containing granules were excised from green images and averaged (30 granules, three cells). (Right) As on the left for the same regions in the red channel. (D) NPY-EGFP-expressing cells were loaded with FM4-64 as in AC but then ruptured with a jet of buffer solution. Patches of membrane remained, and a small region of one such patch is shown. (E Left) Uptake of FM4-64 by intact cells. Cells exposed to FM4-64 for various times were washed and then imaged. The fraction of granules containing FM4-64 is plotted against time in the presence of FM4-64 (Left). (Right) Loss of dye from intact cells. Cells were loaded with a 12-hr exposure to FM4-64, then washed, incubated for various times in dye-free solution, and finally imaged. Each point is the mean from at least 20 granules each in at least five cells.
Fig. 2.
Fig. 2.
Granules lose FM4-64 during exocytosis. (A) Images taken from a video clip of a granule containing NPY-EGFP (Upper) and FM4-64 (Lower) during exocytosis. The first frame wherein NPY-EGFP brightened measurably was taken to mark the start of exocytosis and the time origin. Granules usually continued to brighten, reaching maximal brightness 30 ms later. For clarity, each pixel value was multiplied by 10 and the resulting images were low-pass filtered (3 pixels), but all analysis was done before multiplication and filtering. (B) Plot of the NPY-EGFP fluorescence of the granule in A, measured in a 610-nm-diameter circle. Fluorescence in a concentric annulus was subtracted as background. Fusion is taken to have occurred at the first sign of the granule getting brighter, thus defining the time origin. (C) FM4-64 fluorescence at the same site, corrected for background using a square area (see Methods). (D) NPY-EGFP fluorescence traces as in B were divided by their average value over the last 150 ms before fusion and then averaged (25 granules, four cells). (E) FM4-64 fluorescence of the granules analyzed in D. Traces as in C had their average value during the last 150 ms before exocytosis subtracted. The results were then averaged and are shown by the line with filled circles. Line without symbols is fluorescence at sites of neighboring granules that did not undergo exocytosis (25 granules, four cells).
Fig. 3.
Fig. 3.
Effect of polarization. (A) FM4-64 fluorescence in larger regions (3.11 × 3.11 μm square) centered over granules undergoing exocytosis. Illumination with either s-polarized (open circles, 25 granules, four cells) or p-polarized light (filled circles, 20 granules, five cells). Individual fluorescence traces were aligned to the moment of exocytosis as determined from the NPY-EGFP signal (see Fig. 2) and divided by their mean value during the last 150 ms before fusion. The results were then averaged. The dashed line was fitted to the traces 150 ms before exocytosis, and its slope is attributed to photobleaching. No background subtraction was applied to the images other than removing the electronic offset of the camera in total darkness. (B) Image sequences were acquired as in Fig. 2 A but with p-polarized light to highlight dye located in the plasma membrane. To cancel out the fluorescence from neighboring structures not undergoing exocytosis, five sequential frames beginning 300 ms after exocytosis were averaged together, and the result was subtracted from each sequence. The sequences thus treated were added together (20 granules, five cells) and subjected to 3-pixel low-pass filtering.
Fig. 4.
Fig. 4.
Some granules reacidify after exocytosis. (A) EGFP-phogrin-labeled granule brightens during exocytosis, dims, and then rebrightens during superfusion with 50 mM NH4Cl. Images processed as in Fig. 2 A for visual clarity. (B1) Fluorescence from granules that failed to undergo exocytosis in that cell. Background subtraction is as in Fig. 2B; the results represent the average of six granules. (B2) Fluorescence of the granule in the center of the images in A, calculated by fitting Gaussian functions (see Methods). (B3) As in B2, but in a granule that underwent exocytosis but did not brighten when NH4Cl was added. (C) NH4Cl-induced fluorescence changes were determined as in B2 and B3. Gaussians were fitted to two images of each granule, one an average over the last 2.5 s before superfusion, the other over a 2.5-s interval starting 1–2s after NH4Cl was applied. Each value in C is the difference, ΔF, between the amplitudes of the two Gaussians, given as a percentage of the amplitude (F) before NH4Cl was applied. NH4Cl was applied 5 to 47 s after exocytosis (64 granules in 19 cells). The two events with ΔF/F = –100% refer to granules where the fitting routine failed for the images taken during the NH4Cl application. (D) As in C except that cells were not stimulated, and the buffer used for superfusion lacked NH4Cl.
Fig. 5.
Fig. 5.
Resealed granules lose FM4-64 but retain phogrin. (A and B) Fluorescence of EGFP-phogrin and of FM4-64 in granules that were grouped according to their response to NH4Cl. Open granules had ΔF/F < –5%, the median in Fig. 4D (open circles, 12 granules in six cells). Resealed granules passed two tests. They brightened visibly in response to NH4Cl, and had ΔF/F >25%, a value larger than any granule in Fig. 4D (filled circles, 13 granules in seven cells). In A, fluorescence traces were analyzed as in Fig. 2B except that EGFP-phogrin rather than NPY-EGFP was used to mark the moment of exocytosis. The resulting traces were then averaged. In B, FM4-64 fluorescence traces were analyzed as in Fig. 2 C and E. (C1 and C2) Fluorescence of two granules containing mRFP, analyzed as in Fig. 2B in cells also expressing NPY-EGFP. Time origin is the moment of fusion as reported by NPY-EGFP. (D) Traces as in C1 and C2 were divided by their average value over the last 2.5 s before fusion, and the results were averaged (10 granules in eight cells). (E) Analysis of a subset of the data shown in Fig. 4C. The granule fluorescence during NH4Cl perfusion was divided by that measured similarly but from images averaged over the first 1.5 s after exocytosis. Resealing (filled bar, n = 17) or lack thereof (open bar, n = 15) was judged by the criteria used in (A and B). The dataset includes granules not stained with FM4-64 but excludes those exposed to NH4Cl >20 s after exocytosis. Values are different with P < 0.0001 by ANOVA.

References

    1. Fernandez, J. M., Neher, E. & Gomperts, B. D. (1984) Nature 312, 453–455. - PubMed
    1. Spruce, A. E., Breckenridge, L. J., Lee, A. K. & Almers, W. (1990) Neuron 4, 643–654. - PubMed
    1. Albillos, A., Dernick, G., Horstmann, H., Almers, W., Alvarez de Toledo, G. & Lindau, M. (1997) Nature 389, 509–512. - PubMed
    1. Ales, E., Tabares, L., Poyato, J. M., Valero, V., Lindau, M. & Alvarez de Toledo, G. (1999) Nat. Cell Biol. 1, 40–44. - PubMed
    1. Angleson, J. K., Cochilla, A. J., Kilic, G., Nussinovitch, I. & Betz, W. J. (1999) Nat. Neurosci. 2, 440–446. - PubMed

Publication types