. 2004 Jun 1;101(22):8408-13.
doi: 10.1073/pnas.0401561101. Epub 2004 May 20.

Differential plague-transmission dynamics determine Yersinia pestis population genetic structure on local, regional, and global scales

Affiliations

Differential plague-transmission dynamics determine Yersinia pestis population genetic structure on local, regional, and global scales

Jessica M Girard et al. Proc Natl Acad Sci U S A. .

Abstract

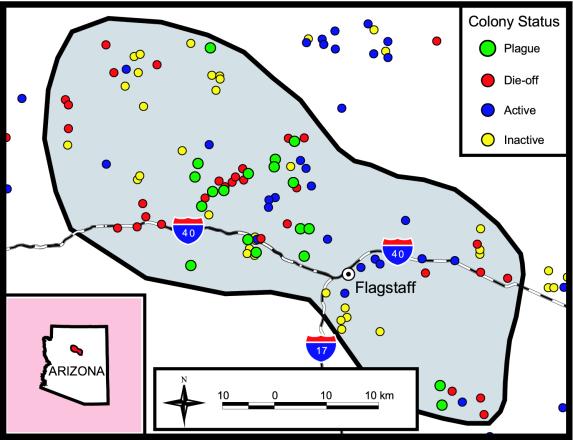
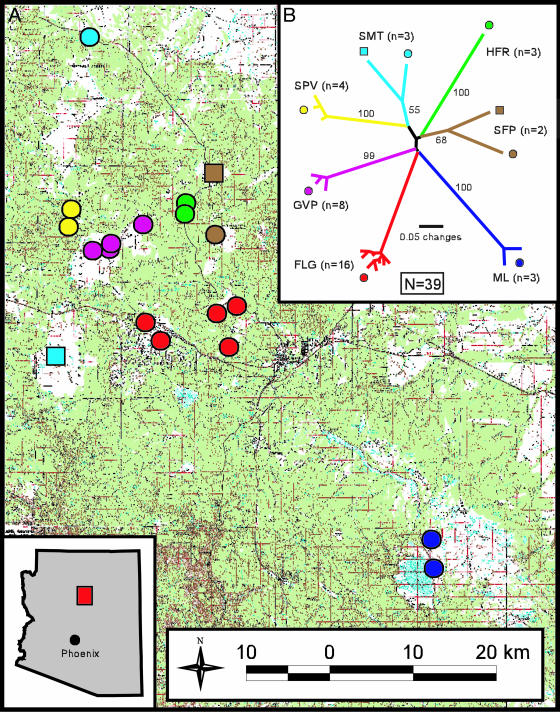
Plague, the disease caused by the bacterium Yersinia pestis, has greatly impacted human civilization. Y. pestis is a successful global pathogen, with active foci on all continents except Australia and Antarctica. Because the Y. pestis genome is highly monomorphic, previous attempts to characterize the population genetic structure within a single focus have been largely unsuccessful. Here we report that highly mutable marker loci allow determination of Y. pestis population genetic structure and tracking of transmission patterns at two spatial scales within a single focus. In addition, we found that in vitro mutation rates for these loci are similar to those observed in vivo, which allowed us to develop a mutation-rate-based model to examine transmission mechanisms. Our model suggests there are two primary components of plague ecology: a rapid expansion phase for population growth and dispersal followed by a slower persistence phase. This pattern seems consistent across local, regional, and even global scales.


Figures

Fig. 1.
Fig. 1.
Distribution and status of Gunnison's prairie dog colonies near Flagstaff. Colored circles indicate the status of colonies as of September 2001. The gray polygon identifies the extent (≈350 km2) of plague activity that affected many of these populations during the spring and summer of 2001. Ninety-nine prairie dog colonies were surveyed within this area. Of the 99 colonies, 49 (49%) experienced die-offs (>99% mortality) between May and September of 2001; Y. pestis was confirmed as the causative agent of 19 die-offs. Colonies were categorized based on the following criteria. Plague (n = 19): (i) evidence of recent (<1 month) prairie dog activity throughout the area (i.e., fresh scat) but no prairie dogs seen or heard or just a few (<1 per hectare) individuals scattered throughout the entire colony area; (ii) Y. pestis-positive fleas collected from at least one prairie dog burrow; and (iii) most burrow entrances open. Die-off (n = 30): same as plague criteria but no Y. pestis-positive fleas collected. Active (n = 19): (i) live prairie dogs observed throughout the area at normal densities; and (ii) most burrows entrances open. Inactive (n = 31): (i) no prairie dogs seen or heard anywhere in the area and only old scat, if any, present; and (ii) most burrow entrances closed.
Fig. 2.
Fig. 2.
Spatial (A) and phylogenetic (B) relationships among 39 regional Y. pestis DNA samples from north-central Arizona indicating significant clustering in both geographic and genetic space (for the specific methodology, see Supporting Materials and Methods). Y. pestis DNA was extracted from 39 flea pools collected from 19 different prairie dog colonies. (A) Map of regional study area illustrating the patchy distribution of grassland habitat (white areas) within the dominant forest habitat (green areas) as well as the location of the 19 prairie dog colonies from which samples were collected. Colonies were grouped and assigned a corresponding color code based on phylogenetic analyses of the samples collected from them. Because all samples from any given colony were assigned to the same phylogenetic group, just the locations and group status of the 19 colonies are indicated on the map. (B) Unrooted neighbor-joining tree for the 39 regional samples, which was created in paup (20) by using size data for the 43 Y. pestis MLVA markers and character weighting. Bootstrap values also were generated in paup by using 10,000 simulations. Of the 43 MLVA markers, 22 were polymorphic in the data set and the samples were divided into seven distinct groups, including: Hochderffer (HFR), San Francisco Peaks (SFP), Mormon Lake (ML), Flagstaff (FLG), Government Prairie (GVP), Spring Valley (SPV), and Sitgreaves Mountain (SMT). Samples within the San Francisco Peaks and Sitgreaves Mountain groups separated into two distinct clades based on colony of origin. These within-group clades are distinguished on the map and on the tree by squares and circles of the same color.
Fig. 3.
Fig. 3.
Phylogenetic and spatial analyses of the 2001 Ft. Valley plague outbreak. (A) Unrooted phylogenetic analysis based on cladistic principles and maximum-parsimony assumptions (20). We assumed that the dominant genotype (FV-1) was central to the other rarer types and that character-state changes were consistent with in vitro mutation rates and products (Table 1). This unrooted tree contains 24 mutational steps and has a consistency index of 0.80. Individual character-state changes are indicated by lowercase letters. Relative to the FV-1 genotype, these changes are: a, M19Δ-6; b, M27Δ+8; c, M58Δ+17; d, M19Δ-24; e, M34Δ+9; f, M76Δ-41; g, M31Δ+8; h, M79Δ-40; i, M31Δ-8; j, M19Δ-54; k, M34Δ-54; l, M19Δ-6; m, M34Δ-45; n, M34Δ-81; o, M34Δ-90; p, M19Δ+6; q, M34Δ-90; r, M34Δ+9, s, M34Δ+9; t, M19Δ+12; u, M27Δ-8; v, M19Δ-6; w, M75Δ-18; x, M22Δ+7. (B) Individual genotypes are represented by colored symbols and spatially mapped by using arcview. Genotypes observed only once are represented by squares and are numbered. More common genotypes are represented by colored circles and defined in the legend. The FV-1 isolate used to generate the Table 1 data was collected from the black-circled location.

Similar articles

Cited by

References

    1. Perry, R. D. & Fetherston, J. D. (1997) Clin. Microbiol. Rev. 10, 35-66. - PMC - PubMed
    1. Achtman, M., Zurth, K., Morelli, G., Torrea, G., Guiyoule, A. & Carniel, E. (1999) Proc. Natl. Acad. Sci. USA 96, 1403-1408. - PMC - PubMed
    1. Poland, J. D. & Barnes, A. M. (1979) in CRC Handbook Series in Zoonoses, ed. Steele, J. (CRC, Boca Raton, FL), pp. 515-559.
    1. Link, V. B. (1955) Public Health Mon. 26, 1-120. - PubMed
    1. Biggins, D. E. & Kosoy, M. Y. (2001) J. Mammal. 82, 906-916.

Publication types