. 2004 Jun;113(11):1535-49.
doi: 10.1172/JCI19906.

Glycogen synthase kinase-3beta mediates convergence of protection signaling to inhibit the mitochondrial permeability transition pore

Affiliations

Glycogen synthase kinase-3beta mediates convergence of protection signaling to inhibit the mitochondrial permeability transition pore

Magdalena Juhaszova et al. J Clin Invest. 2004 Jun.

Abstract

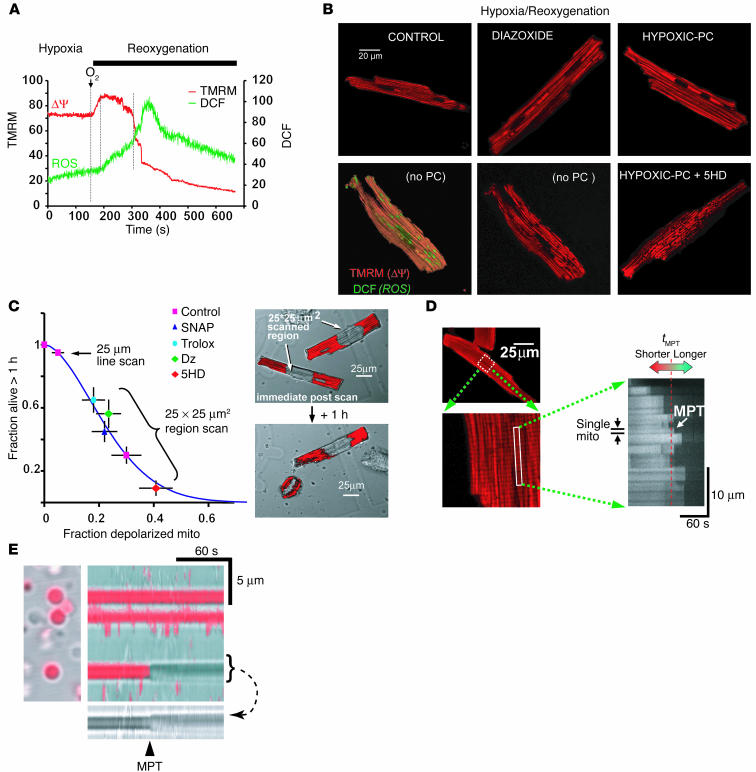
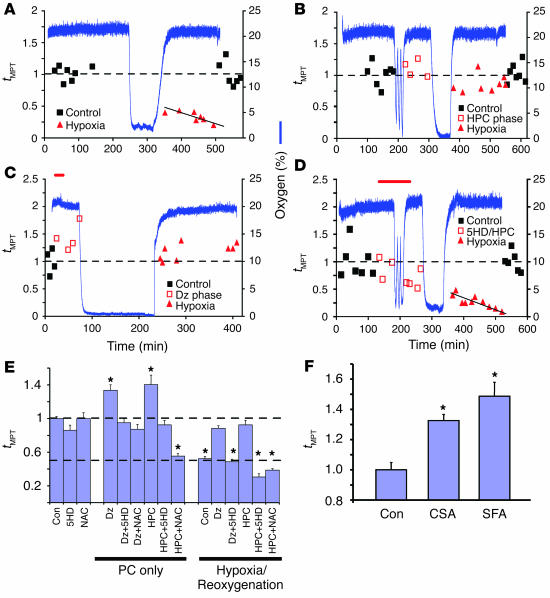
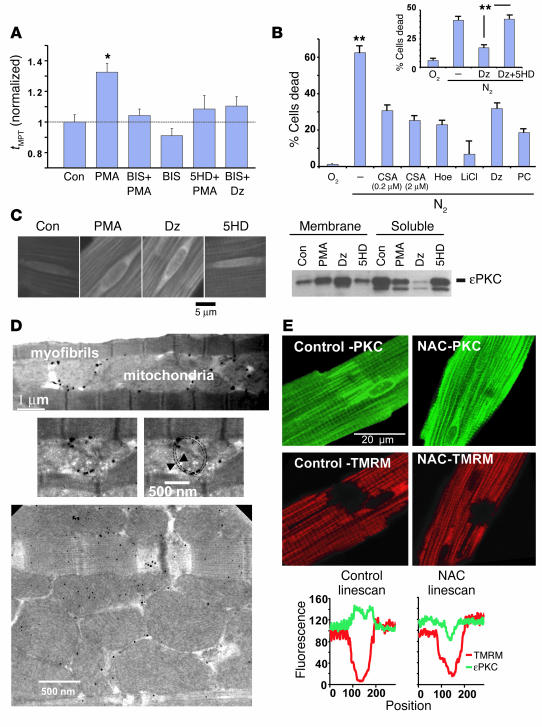
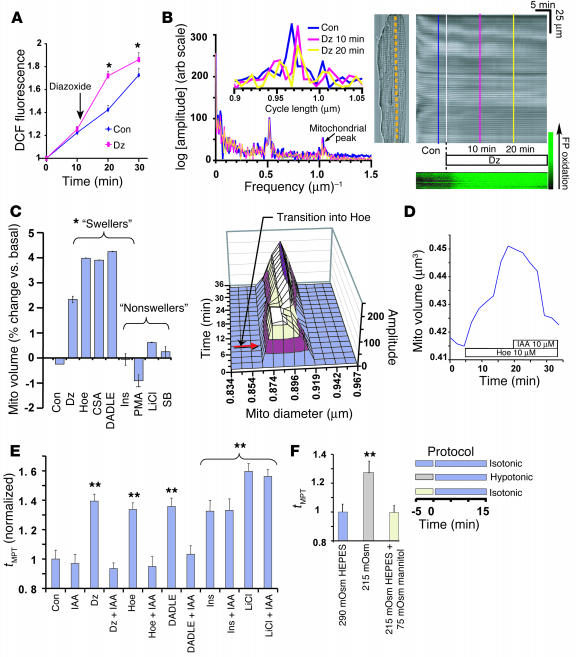
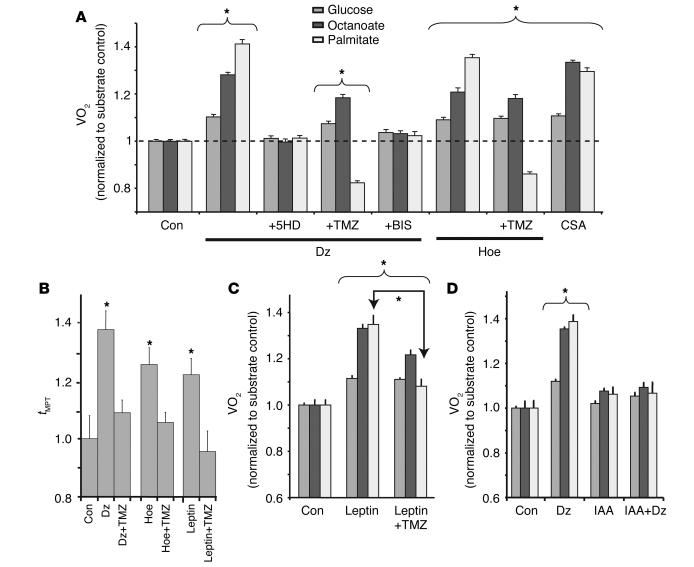
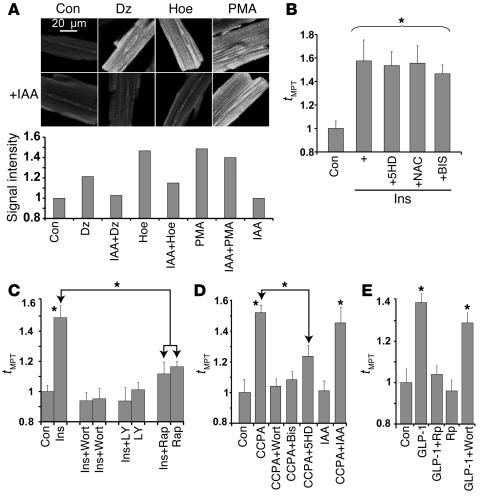
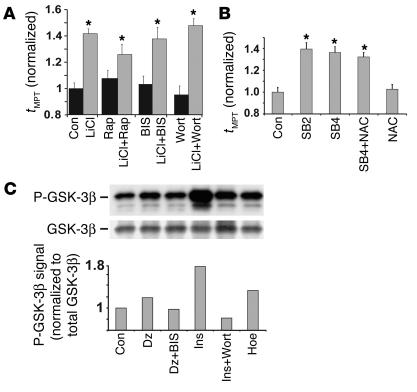
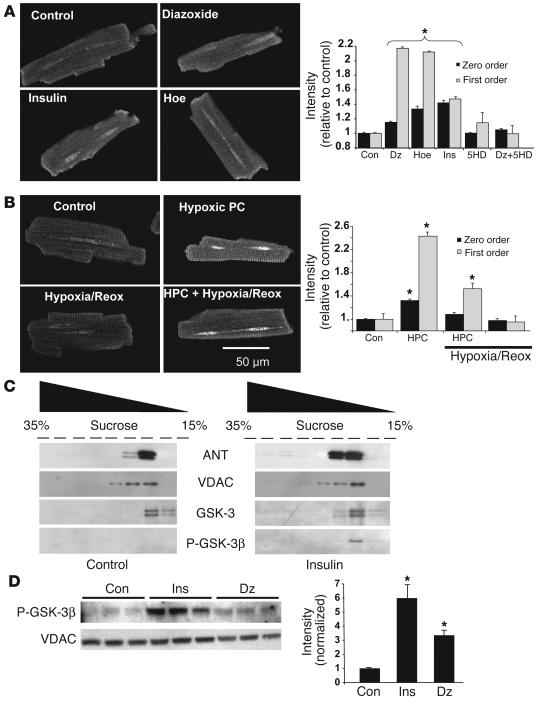
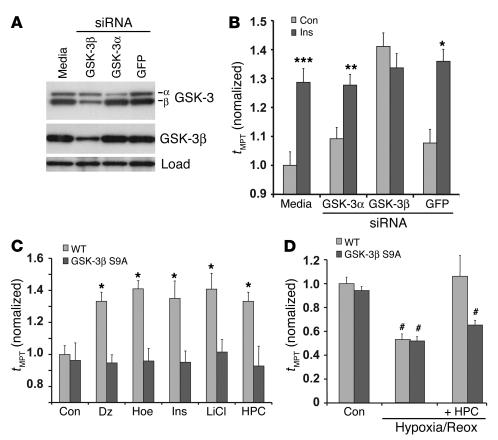
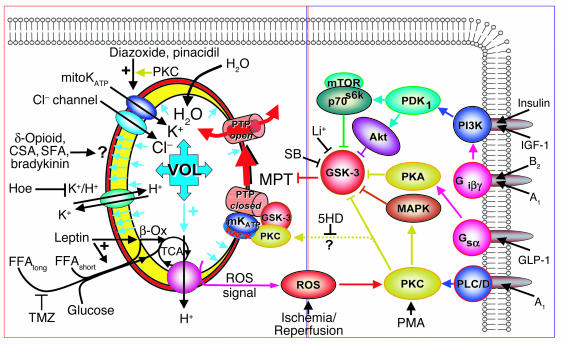
Environmental stresses converge on the mitochondria that can trigger or inhibit cell death. Excitable, postmitotic cells, in response to sublethal noxious stress, engage mechanisms that afford protection from subsequent insults. We show that reoxygenation after prolonged hypoxia reduces the reactive oxygen species (ROS) threshold for the mitochondrial permeability transition (MPT) in cardiomyocytes and that cell survival is steeply negatively correlated with the fraction of depolarized mitochondria. Cell protection that exhibits a memory (preconditioning) results from triggered mitochondrial swelling that causes enhanced substrate oxidation and ROS production, leading to redox activation of PKC, which inhibits glycogen synthase kinase-3beta (GSK-3beta). Alternatively, receptor tyrosine kinase or certain G protein-coupled receptor activation elicits cell protection (without mitochondrial swelling or durable memory) by inhibiting GSK-3beta, via protein kinase B/Akt and mTOR/p70(s6k) pathways, PKC pathways, or protein kinase A pathways. The convergence of these pathways via inhibition of GSK-3beta on the end effector, the permeability transition pore complex, to limit MPT induction is the general mechanism of cardiomyocyte protection.


Figures

Figure 1
Figure 1
ROS are involved in mitochondrial deterioration during hypoxia/reoxygenation. (A) Reoxygenation-induced mitochondrial hyperpolarization leads to increased ROS. Mitochondria stained with TMRM (ØΨ, red) and DCF (ROS, green) were laser line-scanned (2 Hz) during hypoxia and the reoxygenation phase. The ROS burst is delayed after reoxygenation and starts at the maximum ØΨ. Mitochondrial hyperpolarization lasts for approximately 2 minutes, followed by loss of ØΨ. (B) ØΨ loss in a significant fraction of mitochondria, caused by hypoxia/reoxygenation. Depolarized mitochondria (red-fluorescence “holes”; bottom panels) are associated with increased ROS (green; bottom left panel). Hypoxic PC or pharmacologic PC (represented by Dz) prevents mitochondrial depolarization, and 5HD accentuates the loss. (C) Cell survival after constant-energy photoexcitation of a 25 ∞ 25 ∝m2 region. The right panels show TMRM-stained cells (red) immediately after, and 1 hour after, irradiation. Survival is inversely related to the fraction of mitochondria (mito) undergoing MPT induction and is improved by ROS scavenger (Trolox), NO donor (SNAP), and Dz and impaired by 5HD. (D) Methodology used to determine the ROS threshold of MPT induction. Mitochondria stained with TMRM (red) were laser line-scanned until MPT induction. The average time required for the standardized photoproduction of ROS to cause MPT induction (tMPT) is taken as the index of the ROS threshold in that cell. (E) Two-hertz line scan of individual isolated cardiac mitochondria. Light transmittance (gray) and TMRM fluorescence (red) are overlaid. The abrupt loss of ØΨ (TMRM) and increase in volume (arrow) are similar to those observed in situ (D). Vertical flickering in the image is an artifact caused by movement of adjacent floating mitochondria.
Figure 2
Figure 2
Change in MPT ROS threshold (tMPT) under reoxygenation and hypoxic and pharmacologic PC. (A) Hypoxia/reoxygenation causes a rapid and progressive decline in tMPT (control, black squares; after reoxygenation, red triangles; O2 in the buffer, blue trace). (B) Hypoxic (HPC) (three 5-minute cycles of hypoxia/reoxygenation) improves tMPT (red triangles compared with control, shown in black squares). (C) Dz pretreatment (30 ∝M for 15 minutes, red bar) prevents the decline in tMPT after hypoxia/reoxygenation. (D) 5HD treatment (500 ∝M, during hypoxic PC phase only, red bar) abolishes the hypoxic PC_mediated protection against the decline in tMPT after hypoxia/reoxygenation. (E) Summary of the effects of hypoxia/reoxygenation and hypoxic and pharmacologic PC on tMPT. *P < 0.01 vs. control (Con). (F) Both cyclosporin A (CSA) (0.2 ∝M) and SFA (1 ∝M) enhance MPT ROS threshold (measured more than 60 minutes after washout). *P < 0.01 vs. control.
Figure 3
Figure 3
Mechanisms of protection. (A) MPT susceptibility to ROS (tMPT) can be regulated by the mitoKATP: role of PKC. *P < 0.001 vs. control (Con). (B) Activation of distinct protection pathways improves cell survival to a similar degree in the hypoxia/reoxygenation protocol used to assess tMPT. Hypoxia/reoxygenation groups included treatment with cyclosporin A, Hoe, Li+, Dz, and PC. The protective effect of Dz is abolished by 5HD (inset). **P < 0.02. (C) Translocation of εPKC toward mitochondria, induced by mitoKATP activation. The panels on the left represent immunostained cardiac myocytes (15 ∞ 15 ∝m2 region surrounding the nucleus, shown for technical consistency). The immunoblot on the right shows that both Dz and PMA induce εPKC translocation from the soluble to the membranous cellular fraction. (D) Transmission electron microscopy of immunogold-labeled εPKC in a cardiac myocyte from a heart treated with PMA (100 nM, 15 minutes), demonstrating mitochondrial membrane localization (right middle panel; dashed circle outlines a mitochondrial profile); immunolabeling is absent in control (not shown). (E) ROS-induced PKC translocation toward mitochondria. Photoexcitation-mediated MPT induction in an approximately 10 ∞ 10 ∝m2 region in TMRM-loaded cardiac myocytes (middle panels, red), and εPKC immunostaining (top panels, green) in the same cells. The right panels show effects of the ROS scavenger NAC. The bottom panels compare the εPKC labeling through the photoexcited regions.
Figure 4
Figure 4
Mechanisms of protection dependent on mitochondrial swelling. (A) Enhanced ROS generation (in DCF-loaded cells, n > 50) during mitoKATP activation by Dz. *P < 0.02 vs. control. (B) Assessment of change in mitochondrial volume after Dz treatment by Fourier analysis. Laser line-scan imaging of in situ mitochondria was performed along the long axis of the cell (right panels) during Dz exposure. High-resolution transmittance (gray image) and flavoprotein autofluorescence (488 nm excitation, green image) were obtained simultaneously. The left panel shows the Fourier frequency-domain spectrum from the transmittance line-scan data during the control period and periods of treatment with Dz for 10 and 20 minutes. The first-order peak indicates the regular sarcomere Z structure. The spectrum inset enlarges the second-order peak shifts (converted to micrometer scale), indicating small Dz-mediated changes in mitochondrial volume. Arb scale, arbitrary scale; FP flavoproteins. (C and D) Mitochondrial-volume changes induced by swellers and nonswellers (“SB” indicates SB 415286). C (right panel) and D show time-dependent volume changes after Hoe, and the reversal of the swelling effect by inhibition of Cl_ transport using IAA94 (D). Ins, insulin. (E) Protection by mitochondrial swellers (but not by nonswellers) requires Cl_ channel flux. (F) Osmotic change induces modulation of tMPT measured under isotonic conditions and 15 minutes after transient (5 minutes) hypotonic conditions. **P < 0.01 (and all bars under brace) vs. control (E and F).
Figure 5
Figure 5
Relationship among mitochondrial swelling, metabolic flux/electron transport, and protection. (A) Mitochondrial swellers activate cell respiration. Three metabolic substrates were used: glucose, octanoate, and palmitate. Values indicated above the control bars are actual respiration rates (nmol O2/min/106 cells). (B) TMZ blocks protection by Dz, Hoe, and leptin in cardiac myocytes metabolizing palmitate. (C) Respiratory activation by leptin in cardiac myocytes metabolizing different substrates. (D) Sensitivity of Dz-induced respiratory activation to Cl_ channel inhibition. *P < 0.05 (and all bars under brace) vs. control.
Figure 6
Figure 6
Distinct mechanisms of mitochondrial swelling_dependent and _independent protection. (A) The effect of Cl_ channel inhibition on sweller-induced εPKC translocation. Translocation by the nonsweller PMA is insensitive to IAA94. (B) Mitochondrial swelling_independent protection does not require the mitoKATP, ROS, or PKC. (C and D) Reversal of insulin-induced and A1 agonist_induced (CCPA-induced) protection by inhibitors of PI3K (wortmannin [wort] and LY 294002) and mTOR (rapamycin [rap]). CCPA protection is also mediated in parallel by swelling-independent PKC and mitoKATP pathways. (E) GLP-1_induced protection is mediated by PKA and blocked by the PKA inhibitor Rp-8-CPT-cAMPS (Rp). *P < 0.01 (and all bars under brace) vs. control.
Figure 7
Figure 7
Central role of GSK-3β in protection. (A and B) Protection induced by Li+, SB 216763 (SB2), or SB 415286 (SB4) cannot be reversed by PKC, PI3K, or mTOR inhibitors (A) or by NAC (B), respectively. *P < 0.05 vs. control. (C) Phosphorylation of GSK-3β (serine-9) in cell lysates, caused by pharmacologic PC. The immunoblot data are representative of three independent experiments.
Figure 8
Figure 8
Localization and regulation of a mitochondrial GSK-3β pool during protection signaling. (A and B) P-GSK-3β immunocytochemical labeling: changes in average versus compartmentalized signal intensity determined from 2D Fourier analysis (see text; images of cells exposed to 5HD and to Dz plus 5HD not shown). *P < 0.01 (all bars under brace) vs. respective control. (C) Immunoblots of mitochondrial membrane sucrose gradient fractions, from control and insulin-treated (30 nM) rat hearts, probed with adenine nucleotide translocator (ANT), voltage dependent anion channel (VDAC), GSK-3, and P-GSK-3β. (D) Immunoblot of total mitochondrial proteins isolated from control, insulin-treated (30 nM), and Dz-treated (30 ∝M) rat hearts. **P < 0.03 vs. control.
Figure 9
Figure 9
GSK-3β, and not GSK-3α, regulates the protection state. (A) SiRNA treatment specifically decreases respective protein levels of GSK-3α and GSK-3β in neonatal rat cardiac myocytes; GFP siRNA and media alone served as negative controls. Immunoblot of cell lysates probed with antibodies against GSK-3α/β, GSK-3β, and 39-kDa subunit of mitochondrial Complex I (as a loading control). The immunoblot is representative of two independent experiments. (B) Silencing of GSK-3β, but not of GSK-3α, enhances tMPT to levels comparable to insulin-induced protection in neonatal rat cardiac myocytes. Data comprise two independent experiments; n = 30 in each group (except n = 22 for GFP siRNA). *P < 0.02, **P < 0.001, ***P < 0.0001 vs. respective control. (C) Constitutive activation of GSK-3β prevents ability to engage protective signaling. GSK-3β inhibition is required for protection against oxidative stress. Both mitochondrial sweller_dependent and _independent protection mechanisms are abolished in adult cardiac myocytes from GSK-3β S9A TG mice. *P < 0.02 vs. control. (D) Hypoxic PC protection after hypoxia/reoxygenation is abolished in adult cardiac myocytes from GSK-3β S9A TG mice. #P < 0.01 vs. control.
Figure 10
Figure 10
The integrated pathways of protection. Schematic showing the principal mechanisms: pathways dependent on change in mitochondrial volume (“swellers” such as Dz, pinacidil, leptin, DADLE, Hoe, and cyclosporin A; left, outlined in red) and pathways independent of change in mitochondrial volume (“nonswellers” such as PMA, insulin, IGF-1, CCPA, GLP-1, Li+, SB 216763, and SB 415286; right, outlined in blue). The convergence of these pathways via inhibition of GSK-3β on the end effector, the permeability transition pore (PTP) complex, to limit MPT induction, is the general mechanism of protection. VOL, volume; β-Ox, β-oxidation; TCA, tricarboxylic acid cycle; PLC/D phospholipase C and phospholipase D.

Comment in

Similar articles

Cited by

References

    1. Green DR, Reed JC. Mitochondria and apoptosis. Science. 1998;281:1309–1312. - PubMed
    1. Murry CE, Jennings RB, Reimer KA. Preconditioning with ischemia: a delay of lethal cell injury in ischemic myocardium. Circulation. 1986;74:1124–1136. - PubMed
    1. Kloner RA, Bolli R, Marban E, Reinlib L, Braunwald E. Medical and cellular implications of stunning, hibernation, and preconditioning: an NHLBI workshop. Circulation. 1998;97:1848–1867. - PubMed
    1. Inoue I, Nagase H, Kishi K, Higuti T. ATP-sensitive K+ channel in the mitochondrial inner membrane. Nature. 1991;352:244–247. - PubMed
    1. Garlid KD, et al. Cardioprotective effect of diazoxide and its interaction with mitochondrial ATP-sensitive K+ channels. Possible mechanism of cardioprotection. Circ. Res. 1997;81:1072–1082. - PubMed

Publication types

MeSH terms

Substances