Comparative Study
. 2004 Jun 28;474(3):364-78.
doi: 10.1002/cne.20138.

Differential expression of 5HT-1A, alpha 1b adrenergic, CRF-R1, and CRF-R2 receptor mRNA in serotonergic, gamma-aminobutyric acidergic, and catecholaminergic cells of the rat dorsal raphe nucleus

Affiliations
Comparative Study

Differential expression of 5HT-1A, alpha 1b adrenergic, CRF-R1, and CRF-R2 receptor mRNA in serotonergic, gamma-aminobutyric acidergic, and catecholaminergic cells of the rat dorsal raphe nucleus

Heidi E W Day et al. J Comp Neurol. .

Abstract

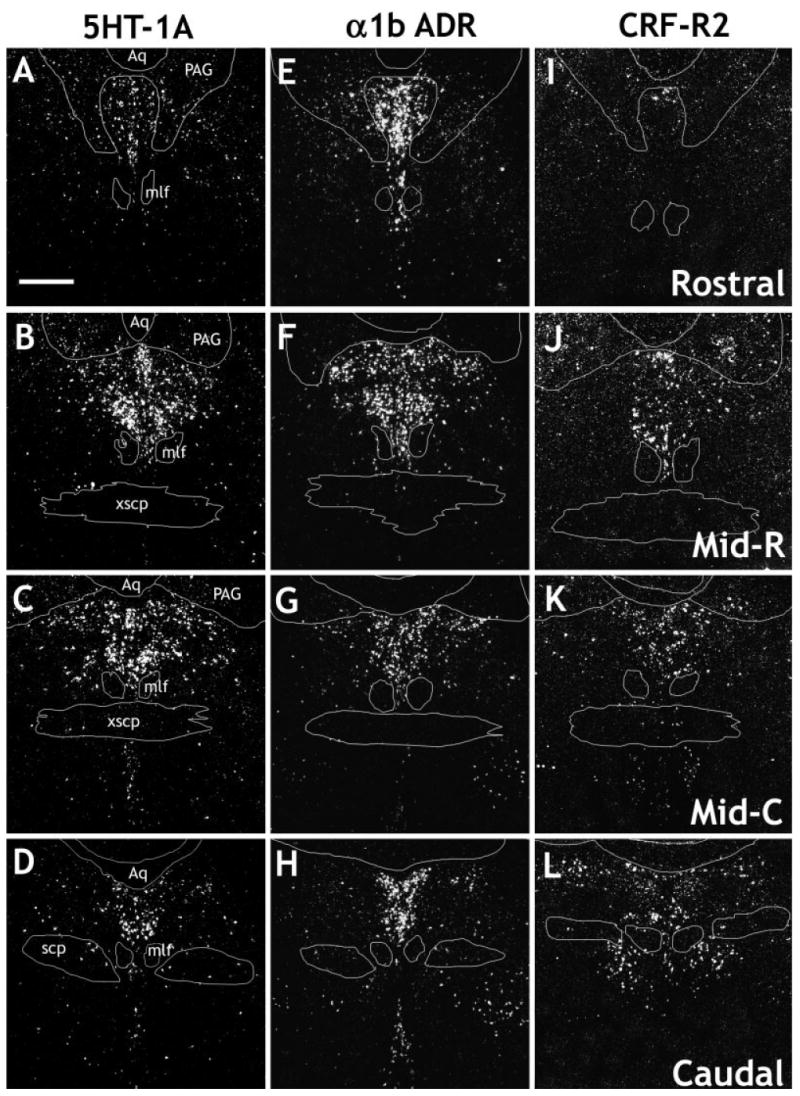
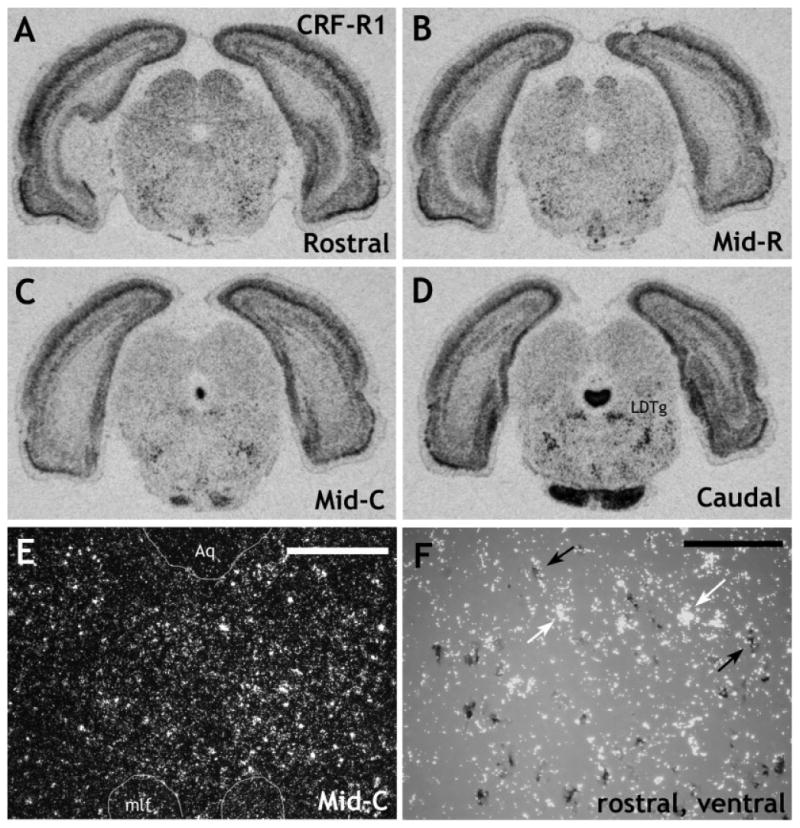
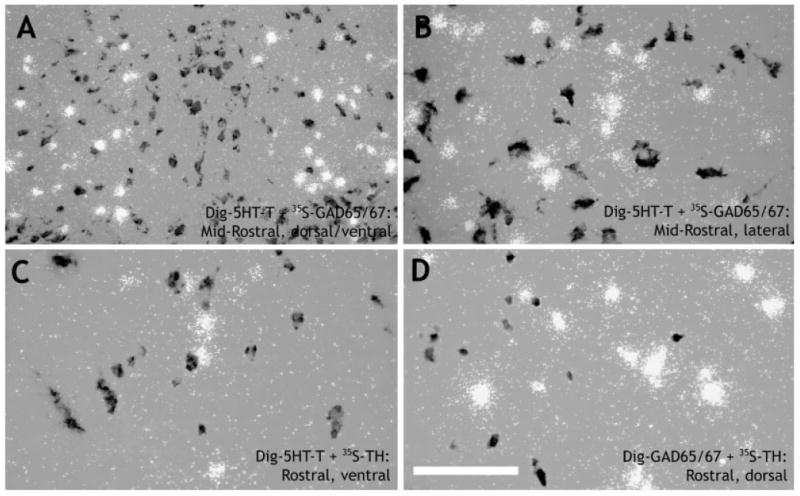
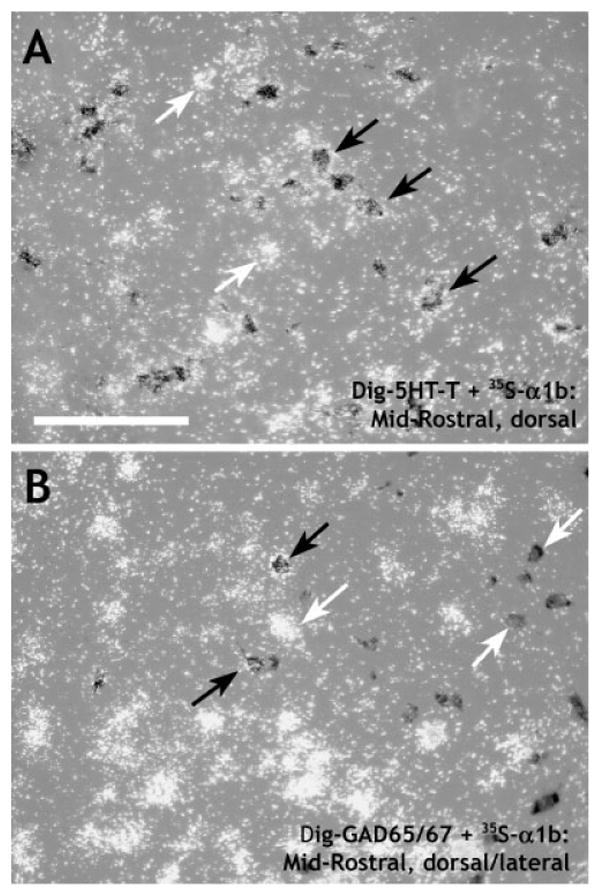
The dorsal raphe nucleus (DR) has a topographic neuroanatomy consistent with the idea that different parts of this nucleus subserve different functions. Here we use dual in situ hybridization to describe the rostral-caudal neurochemical distribution of three major cell groups, serotonin (5-hydroxytryptamine; 5-HT), gamma-aminobutyric acid (GABA), and catecholamine, and their relative colocalization with each other and mRNA encoding four different receptor subtypes that have been described to influence DR responses, namely, 5HT-1A, alpha(1b) adrenergic (alpha(1b) ADR), and corticotropin-releasing factor type 1 (CRF-R1) and 2 (CRF-R2) receptors. Serotonergic and GABAergic neurons were distributed throughout the rostral-caudal extent of the DR, whereas catecholaminergic neurons were generally restricted to the rostral half of the nucleus. These phenotypes essentially represent distinct cell populations, because the neurochemical markers were rarely colocalized. Both 5HT-1A and alpha(1b) ADR mRNA were highly expressed throughout the DR, and the vast majority of serotonergic neurons expressed both receptors. A smaller percentage of GABAergic neurons also expressed 5HT-1A or alpha(1b) ADR mRNA. Very few catecholaminergic cells expressed either 5HT-1A or alpha(1b) ADR mRNA. CRF-R1 mRNA was detected only at very low levels within the DR, and quantitative colocalization studies were not technically feasible. CRF-R2 mRNA was mainly expressed at the middle and caudal levels of the DR. At midlevels, CRF-R2 mRNA was expressed exclusively in serotonin neurons, whereas, at caudal levels, approximately half the CRF-R2 mRNA was expressed in GABAergic neurons. The differential distribution of distinct neurochemical phenotypes lends support to the idea of functional differentiation of the DR.


Figures

Fig. 1
Fig. 1
Schematic coronal diagrams showing the rat dorsal raphe nucleus from rostral through caudal levels (A–H). Numbers refer to the distance from bregma. Colocalization cell counts were taken from sections at 200-μm intervals, with counts from two sections averaged for each of four levels: rostral (approximately −7.2 mm and −7.4 mm), midrostral (approximately −7.6 mm and −7.8 mm), midcaudal (approximately −8.0 and −8.2 mm), and caudal (approximately −8.4 mm and −8.6 mm). 3, Oculomotor nucleus; 4, trochlear nucleus; A8, A8 dopamine cells; Aq, aqueduct (Sylvius); Atg, anterior tegmental nucleus; CLi, caudal linear nucleus of the raphe; DLPAG, dorsolateral PAG; DR, dorsal raphe; DRC, DR caudal; DRD, DR dorsal; DRI, DR interfascicular; DRV, DR ventral; DRVL, DR ventrolateral; DTgP, dorsal tegmental nucleus, pericentral; LDTg, laterodorsal tegmental nucleus; LPAG, lateral PAG; mlf, medial longitudinal fasciculus; MnR, median raphe nucleus; Pa4, paratrochlear nucleus; PAG, periaqueductal gray; PMnR, paramedian raphe nucleus; PnO, pontine reticular nucleus, oral part; PnR, pontine raphe nucleus; scp, superior cerebellar peduncle; SPTg, subpedencular tegmental nucleus; ts, tectospinal tract; VLPAG, ventrolateral PAG; VTg, ventral tegmental nucleus; xscp, decussation of the scp. Adapted, with permission, from Paxinos and Watson (1998).
Fig. 2
Fig. 2
Darkfield digital photomicrographs of serotonin transporter mRNA to illustrate the approximate areas used for microscopic cellular analysis (for each probe combination), at rostral (A; approximately −7.2 to −7.4 mm relative to Bregma), midrostral (B; Mid-R, approximately −7.6 to −7.8 mm relative to Bregma), midcaudal (C; Mid-C, approximately −8.0 to −8.2 mm relative to Bregma), and caudal (D; approximately −8.4 mm to −8.6 mm relative to Bregma) levels. D, dorsal; V, ventral; L, lateral. Scale bar = 500 μm.
Fig. 3
Fig. 3
Darkfield digital photomicrographs showing the distribution of serotonin transporter (5HT-T; A–D); glutamic acid decarboxylase isoforms 65 and 67, used as a marker for γ-aminobutyric acid (GAD65/67; E–H); and tyrosine hydroxylase, used as a marker for catecholamines (TH; I–L), mRNAs in the rat DR. The following levels are shown: rostral (approximately −7.2 to −7.4 mm relative to bregma; A,E,I), midrostral (Mid-R, approximately −7.6 to −7.8 mm relative to bregma; B,F,J), midcaudal (Mid-C, approximately −8.0 to −8.2 mm relative to bregma; C,G,K), and caudal (approximately −8.4 mm to −8.6 mm relative to bregma; D,H,L). Aq, aqueduct; mlf, medial longitudinal fasciculus; PAG, periaqueductal gray; scp, superior cerebellar peduncle; xscp, decussation of superior cerebellar peduncle. Scale bar = 500 μm.
Fig. 4
Fig. 4
Darkfield digital photomicrographs showing the distribution of the serotonin 1A receptor (5HT-1A; A–D), α1b adrenergic receptor (α1b; E–H)m and corticotropin-releasing factor type 2 receptor (CRF-R2; I–L) mRNAs in the rat DR. The following levels are shown: rostral (approximately −7.2 to −7.4 mm relative to bregma; A,E,I), midrostral (Mid-R, approximately −7.6 to −7.8 mm relative to bregma; B,F,J), midcaudal (Mid-C, approximately −8.0 to −8.2 mm relative to bregma; C,G,K), and caudal (approximately −8.4 mm to −8.6 mm relative to bregma; D,H,L). Aq, aqueduct; mlf, medial longitudinal fasciculus; PAG, periaqueductal gray; scp, superior cerebellar peduncle; xscp, decussation of superior cerebellar peduncle. Scale bar = 500 μm.
Fig. 5
Fig. 5
Expression of CRF-R1 mRNA, determined using a full-length riboprobe, in the rat DR. X-ray images at rostral (A), midrostral (B), midcaudal (C), and caudal (D) levels. Although significant expression of CRF-R1 mRNA was detected in several brain regions, including the LDTg, very little CRF-R1 mRNA was detected in the DR. E: Darkfield photomicrograph taken at a midcaudal level, midline, to show the relatively low levels of CRF-R1 mRNA in the DR. F shows DIG-5HT-T with [35S]CRF-R1 at a rostral level, ventral part. DIG-labeled cells were photographed under brightfield illumination (dark gray cells), whereas 35S-labeled cells were photographed under darkfield illumination (clusters of white grains). The photographs were combined in Adobe Photoshop (see Materials and Methods). Black arrows denote double-labeled cells, and white arrows denote single-labeled cells. Although levels of CRF-R1 mRNA expression were not high enough to perform a systematic analysis, it appears that CRF-R1 mRNA is expressed at low levels in both a few 5HT-T and non-5HT-T mRNA containing cells. LDTg, lateral dorsal tegmental nucleus; Aq, aqueduct; mlf, medial longitudinal fasciculus. Scale bars = 400 μm in E; 100 μm in F.
Fig. 6
Fig. 6
Digital photomicrographs showing that serotonin, GABA, and catecholamines are rarely expressed in the same cell in the rat DR. DIG-labeled cells were photographed under brightfield illumination (dark gray cells), whereas 35S-labeled cells were photographed under darkfield illumination (clusters of white grains). The photographs were combined in Adobe Photoshop (see Materials and Methods). A,B: Show DIG-5HT-T (serotonin transporter, used as a marker for serotonergic cells) and [35S]GAD65/67 (glutamic acid decarboxylase, isoforms 65 and 67, used as a marker for GABAergic cells) at a midrostral level. Note that, for the dorsal and ventral DR, GABAergic cells largely flank the midline distribution of serotonergic cells (A), whereas, in the lateral wings, the distribution is more intermingled (B). C: Shows DIG-5HT-T and [35S]TH (used as a marker for catecholamines) at a rostral level, ventral part. D: Shows DIG-GAD65/67 and [35S]TH at a rostral level, dorsal part. Scale bar = 100 μm in D (applies to B–D); 200 μm for A.
Fig. 7
Fig. 7
Digital photomicrographs showing the relative colocalization of serotonin 1A receptor (5HT-1A) mRNA with mRNA markers for serotonin (A) or GABA (B). DIG-labeled cells were photographed under brightfield illumination (dark gray cells), whereas 35S-labeled cells were photographed under darkfield illumination (clusters of white grains). The photographs were combined in Adobe Photoshop (see Materials and Methods). Black arrows denote double-labeled cells, and white arrows denote single-labeled cells. A: Shows DIG-5HT-T (serotonin transporter, used as a marker for serotonergic cells) with [35S]5HT-1A at a midrostral level, ventral part. Note the extensive colocalization, although a few cells expressing 5HT-1A mRNA did not express 5HT-T mRNA. B: Shows DIG-GAD65/67 (glutamic acid decarboxylase, isoforms 65 and 67, used as a marker for GABAergic cells) with [35S]5HT-1A at a midrostral level, dorsal/lateral part. A few cells expressed both GAD65/67 and 5HT-1A mRNAs. Scale bar = 100 μm.
Fig. 8
Fig. 8
Digital photomicrographs showing the relative colocalization of α1b adrenergic receptor (α1b) mRNA with mRNA markers for serotonin (A) or GABA (B). DIG-labeled cells were photographed under brightfield illumination (dark gray cells), whereas 35S-labeled cells were photographed under darkfield illumination (clusters of white grains). The photographs were combined in Adobe Photoshop (see Materials and Methods). Black arrows denote double-labeled cells, and white arrows denote single-labeled cells. A: Shows DIG-5HT-T (serotonin transporter, used as a marker for serotonergic cells) with [35S]α1b at a midrostral level, dorsal part. Note the extensive colocalization, although a number of cells expressing α1b mRNA did not express 5HT-T mRNA. B: Shows DIG-GAD65/67 (glutamic acid decarboxylase, isoforms 65 and 67, used as a marker for GABAergic cells) with [35S]α1b at a midrostral level, dorsal/lateral part. Although many cells were singly labeled, a number of cells expressed both GAD65/67 and α1b mRNAs. Scale bar = 100 μm.
Fig. 9
Fig. 9
Digital photomicrographs showing the relative colocalization of corticotropin-releasing factor type 2 receptor (CRF-R2) mRNA with mRNA markers for serotonin or GABA. DIG-labeled cells were photographed under brightfield illumination (dark gray cells), whereas 35S-labeled cells were photographed under darkfield illumination (clusters of white grains). The photographs were combined in Adobe Photoshop (see Materials and Methods). Black arrows denote double-labeled cells, and white arrows denote single-labeled cells. A: Shows DIG-5HT-T with [35S]CRF-R2 midcaudal, dorsal part. Note the extensive colocalization, although several cells that express 5HT-T mRNA do not express CRF-R2 mRNA. B: Shows DIG-GAD65/67 (glutamic acid decarboxylase, isoforms 65 and 67, used as a marker for GABAergic cells) with [35S]CRF-R2 at a midrostral level, lateral part. Note that there is no colocalization at this level. C: Shows DIG-GAD65/67 (glutamic acid decarboxylase, isoforms 65 and 67, used as a marker for GABAergic cells) with [35S]CRF-R2 at a midcaudal level, ventral part. Note that there is significant colocalization at this level, although many cells remain singly labeled. For orientation, the single-labeled CRF-R2 cells, white grains, denoted by white arrows on the right of the image are approximately at the midline of the ventral DR. Scale bar = 100 μm.

Similar articles

Cited by

References

    1. Baraban JM, Aghajanian GK. Suppression of firing activity of 5-HT neurons in the dorsal raphe by alpha-adrenoceptor antagonists. Neuropharmacology. 1980a;19:355–363. - PubMed
    1. Baraban JM, Aghajanian GK. Suppression of serotonergic neuronal firing by alpha-adrenoceptor antagonists: evidence against GABA mediation. Eur J Pharmacol. 1980b;66:287–294. - PubMed
    1. Baraban JM, Aghajanian GK. Noradrenergic innervation of serotonergic neurons in the dorsal raphe: demonstration by electron microscopic autoradiography. Brain Res. 1981;204:1–11. - PubMed
    1. Belin MF, Nanopoulos D, Didier M, Aguera M, Steinbusch H, Verhofstad A, Maitre M, Pujol JF. Immunohistochemical evidence for the presence of gamma-aminobutyric acid and serotonin in one nerve cell. A study on the raphe nuclei of the rat using antibodies to glutamate decarboxylase and serotonin. Brain Res. 1983;275:329–339. - PubMed
    1. Bittencourt JC, Sawchenko PE. Do centrally administered neuropeptides access cognate receptors?: an analysis in the central corticotropin-releasing factor system. J Neurosci. 2000;20:1142–1156. - PMC - PubMed

Publication types

MeSH terms