. 2004 Jun 1;18(11):1263-71.
doi: 10.1101/gad.1198204.

The histone modification pattern of active genes revealed through genome-wide chromatin analysis of a higher eukaryote

Affiliations

The histone modification pattern of active genes revealed through genome-wide chromatin analysis of a higher eukaryote

Dirk Schübeler et al. Genes Dev. .

Abstract

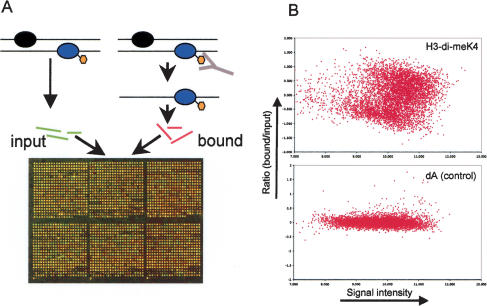
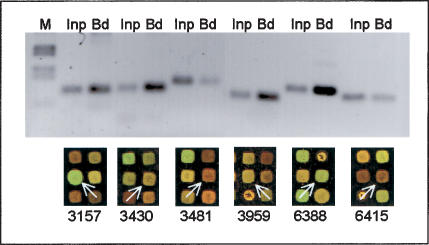
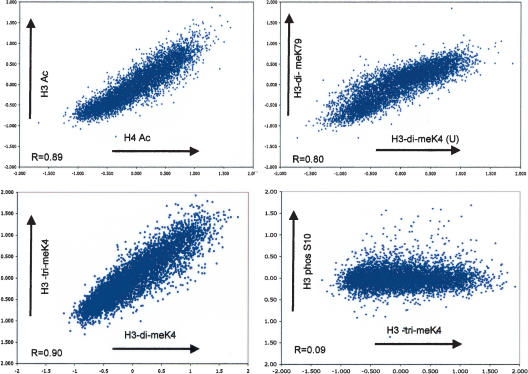
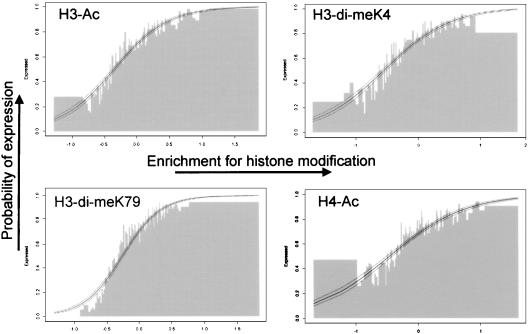
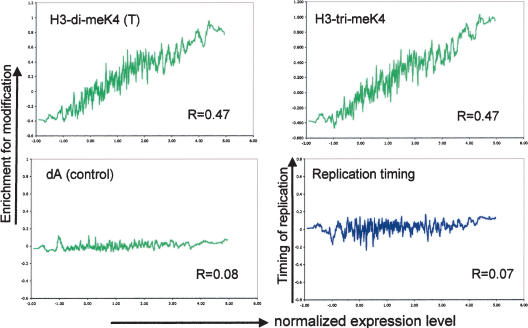
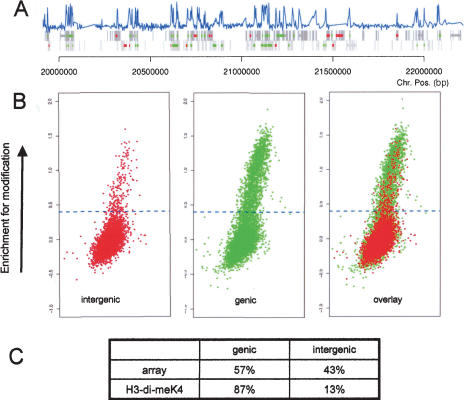
The covalent modification of nucleosomal histones has emerged as a major determinant of chromatin structure and gene activity. To understand the interplay between various histone modifications, including acetylation and methylation, we performed a genome-wide chromatin structure analysis in a higher eukaryote. We found a binary pattern of histone modifications among euchromatic genes, with active genes being hyperacetylated for H3 and H4 and hypermethylated at Lys 4 and Lys 79 of H3, and inactive genes being hypomethylated and deacetylated at the same residues. Furthermore, the degree of modification correlates with the level of transcription, and modifications are largely restricted to transcribed regions, suggesting that their regulation is tightly linked to polymerase activity.


Figures

Figure 1.
Figure 1.
(A) Principle of genome-wide chromatin analysis. Chromatin is purified after cross-linking with formaldehyde and subsequently immunoprecipitated with an antibody specific for a histone modification. The enriched DNA fractions are purified, fluorescently labeled, and cohybridized to a spotted microarray with an input sample that has been labeled with a different dye. The resulting ratio of the signal from the bound-over input fraction is determined after the hybridization and used as a measure for enrichment. (B) Antibody-specific enrichment during ChIP is illustrated by comparing a ChIP with an antibody against a euchromatic histone modification (H3-di-meK4) with a control experiment (dA) in which no antibody has been added. The ratio of the bound-over input fraction versus the signal intensity is plotted (M/A plot, Dudoit et al. 2002a) for both experiments. Notice the increased spread of ratios in the H3-di-meK4 experiment compared with the control experiment, reflecting the specific enrichment during the immunoprecipitation.
Figure 2.
Figure 2.
Control of microarray results by gene-specific PCR. We amplified sequences from input and from immunoprecipitated (= bound) chromatin and compared it with the detection on the microarray. Enrichment by ChIP is indicated by a stronger signal in the PCR from the bound fraction (Bd) and in a stronger microarray signal from the fluorescent dye used to label the bound fraction (here Cy3 = green fluorescence). Lack of enrichment is indicated by a weak PCR signal in the bound fraction compared with input (Inp) and a stronger microarray signal from the input material (here Cy5 = red fluorescence). Shown are six sequences after ChIP against H3-di-meK4 that are analyzed by PCR and microarray. Microarray sections are taken from the same slide with identical color settings. Array spots corresponding to the PCR products are labeled with white arrows. In each case, the PCR confirms the microarray analysis and similar results were obtained for other modifications (data not shown).
Figure 3.
Figure 3.
Pairwise comparisons of different euchromatic histone modifications. Shown are four scatterplots comparing the log2 ratios of bound-over input material for H3-Ac versus H4-Ac, H3-di-meK4 versus H3-di-meK79, H3-tri-meK4 versus H3-di-meK4, and H3phos-S10 versus H3-tri-meK4. A high degree of positive correlation is observed between the euchromatic modifications, indicating that these marks are shared by the same genes. This correlation, however, is not observed when a euchromatic modification is compared with the evenly distributed H3-S10 phosphorylation (see also Table 1).
Figure 4.
Figure 4.
Relationship between transcriptional status and chromatin structure. To determine whether enrichment for the tested euchromatic histone modifications depends on the expression status, we compared the enrichment for a histone modification with the transcriptional status for all single-copy genes present on the array. Genes were ranked according to their enrichment for a particular modification and divided into groups of 50 genes. The percentage of active genes (that is, the probability of expression) in each group was calculated by using an existing expression analysis (Schübeler et al. 2002). The percentage of active genes (Y-axis) is plotted versus the enrichment for a histone modification (X-axis). This presentation shows that genes that are enriched in euchromatic modifications are almost all transcriptionally active, whereas genes that are not enriched are mostly inactive. To validate this observation with the appropriate statistical analysis, we performed logistic regression for all studied modifications. Logistic regression is used if there are only two potential outcomes (binominal) for one of the two variables, which in this case is the transcriptional status (on/off). The resulting logistic regression curve (thick line) and the 95% confidence interval (outer lines) are plotted and in each case show a very strong correlation between enrichment for euchromatic histone modifications and transcriptional activity (a complete set of plots is shown in the Supplemental Material).
Figure 5.
Figure 5.
Genome-wide relationship between transcription rate, euchromatic histone modifications, and timing of DNA replication. The expression level of all active genes was compared with the enrichment for each histone modification and with the timing of DNA replication. The moving average (n = 30) of the normalized expression value is plotted against the enrichment for H3-di-meK4, H3-tri-meK4, the control IP, and the timing of DNA replication. In addition, the Pearson correlation coefficient (R) was calculated for each data set (without averaging). For active genes, we find that the degree of each euchromatic histone modification depends on the level of transcript (additional graphs are in the Supplemental Material), whereas such dependency is observed neither for the control experiment nor for the timing of DNA replication. This indicates that although both histone modifications and replication timing correlate with the transcriptional status of a gene, only euchromatic histone modifications correlate with the level of transcription.
Figure 6.
Figure 6.
Chromosome-wide distribution of H3-K4 methylation in Drosophila. Sequences enriched for H3-di-meK4 were hybridized together with an input control to a DNA microarray representing all nonrepetitive sequences of the Drosophila chromosome 2L, and the ratio of bound-over input material was calculated as a measure of enrichment. (A) The enrichment for H3-dimeK4 of a 2-Mb region is shown. The blue bar represents the enrichment for Lys 4 methylation of histone H3 for each sequence that is present on the microarray. The gray boxes indicate genic regions, with each strand shown separately. For a subset of these genic regions, the transcriptional status has been determined on the cDNA array. These genes are labeled green if active and red if inactive. In the majority of cases, the active genes coincide with a peak in H3-di-meK4 methylation that is largely restricted to the transcribed sequence. (B) Shown are three plots (M/A, see Fig. 1) of fluorescent signal versus enrichment for H3-di-meK4 for the complete chromosomal arm. The enrichment for H3-dimeK4 (Y-axis) is plotted against the signal intensity (X-axis). Sequences that are enriched in the modification are above the dotted line. The left plot shows the enrichments for intergenic regions, of which only a few are enriched. The plot in the middle shows genic regions (independent of their actual transcriptional activity). The comparison of both plots reveals that almost all H3-di-meK4-positive sequences are in genic regions. The right plot shows all spots present on the array. The ratio of genic to intergenic sequences is 1:1 for the complete microarray and 7:1 for the H3-di-meK4 experiment, revealing the restriction of this modification to transcribed regions.

Similar articles

Cited by

References

    1. Adams, M.D., Celniker, S.E., Holt, R.A., Evans, C.A., Gocayne, J.D., Amanatides, P.G., Scherer, S.E., Li, P.W., Hoskins, R.A., Galle, R.F., et al. 2000. The genome sequence of Drosophila melanogaster. Science 287: 2185-2195. - PubMed
    1. Ahmad, K. and Henikoff, S. 2002a. Epigenetic consequences of nucleosome dynamics. Cell 111: 281-284. - PubMed
    1. ____. 2002b. The histone variant H3.3 marks active chromatin by replication-independent nucleosome assembly. Mol. Cell 9: 1191-1200. - PubMed
    1. Bae, E., Calhoun, V.C., Levine, M., Lewis, E.B., and Drewell, R.A.. 2002. Characterization of the intergenic RNA profile at abdominal-A and Abdominal-B in the Drosophila bithorax complex. Proc. Natl. Acad. Sci. 99: 16847-16852. - PMC - PubMed
    1. Bannister, A.J., Schneider, R., and Kouzarides, T. 2002. Histone methylation: Dynamic or static? Cell 109: 801-806. - PubMed

Publication types