. 2004 Jun 2;24(22):5079-90.
doi: 10.1523/JNEUROSCI.0882-04.2004.

Single-channel analysis of KCNQ K+ channels reveals the mechanism of augmentation by a cysteine-modifying reagent

Affiliations

Single-channel analysis of KCNQ K+ channels reveals the mechanism of augmentation by a cysteine-modifying reagent

Yang Li et al. J Neurosci. .

Abstract

The cysteine-modifying reagent N-ethylmaleimide (NEM) is known to augment currents from native M-channels in sympathetic neurons and cloned KCNQ2 channels. As a probe for channel function, we investigated the mechanism of NEM action and subunit specificity of cloned KCNQ2-5 channels expressed in Chinese hamster ovary cells at the whole-cell and single-channel levels. Biotinylation assays and total internal reflection fluorescence microscopy indicated that NEM action is not caused by increased trafficking of channels to the membrane. At saturating voltages, whole-cell currents of KCNQ2, KCNQ4, and KCNQ5 but not KCNQ3 were augmented threefold to fourfold by 50 microm NEM, and their voltage dependencies were negatively shifted by 10-20 mV. Unitary conductances of KCNQ2 and KCNQ3 (6.2 and 8.5 pS, respectively) were much higher that those of KCNQ4 and KCNQ5 (2.1 and 2.2 pS, respectively). Surprisingly, the maximal open probability (P(o)) of KCNQ3 was near unity, much higher than that of KCNQ2, KCNQ4, and KCNQ5. NEM increased the P(o) of KCNQ2, KCNQ4, and KCNQ5 by threefold to fourfold but had no effect on their unitary conductances, suggesting that the increase in macroscopic currents can be accounted for by increases in P(o). Analysis of KCNQ3/4 chimeras determined the C terminus to be responsible for the differential maximal P(o), channel expression, and NEM action between the two channels. To further localize the site of NEM action, we mutated three cysteine residues in the C terminus of KCNQ4. The C519A mutation alone ablated most of the augmentation by NEM, suggesting that NEM acts via alkylation of this residue.


Figures
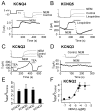
Figure 1.
Figure 1.
NEM enhances the amplitudes of currents in homomeric KCNQ4, KCNQ5, and KCNQ2 but not KCNQ3 channels. Plotted are current amplitudes at 0 mV during the experiments from CHO cells expressing KCNQ4 (A), KCNQ5 (B), KCNQ2 (C), and KCNQ3 (D), studied under whole-cell clamp. Voltage pulses using a classic M-channel protocol (A, inset) were given every 4 sec. Bath applications of NEM (50 μm), TEA (10 mm), or linopirdine (50 μm) are indicated by the bars. Representative current sweeps at the indicated times during the experiments are shown above each plot. E, Bars are mean augmentations by NEM of the currents at 0 mV. For KCNQ4, KCNQ5, KCNQ2, and KCNQ3, they were 2.9 ± 0.4 (n = 7), 3.5 ± 1.0 (n = 6), 3.3 ± 0.6 (n = 5), and 1.1 ± 0.1 (n = 4), respectively. F, Dose–response curve for NEM action on KCNQ2 currents, pooled from five experiments. The data were fitted by a Hill equation with an EC50 of 14.4 ± 1.5 μm and a Hill coefficient of 1.1 ± 0.4 (n = 5).
Figure 2.
Figure 2.
Effect of NEM on the voltage dependence of activation of KCNQ2–5. Shown are families of currents from KCNQ4 (A), KCNQ5 (B), KCNQ2 (C), and KCNQ3 (D) channels, elicited by a range of depolarizations from –80 to 40 mV in 10 mV increments (A, inset) before and after application of NEM (50 μm). Plotted below the current traces are the fractional activation versus voltage, quantified as the tail current amplitudes following the range of test potentials, normalized to the maximal tail current after application of NEM. The activation curves were fitted by Boltzmann equations (see Materials and Methods). For KCNQ4, KCNQ5, KCNQ2, and KCNQ3, before NEM (open circles), V½ and k were –23.1 and 10.4, –31.0 and 13.1, –27.5 and 9.9, and –52.3 and 5.7 mV, respectively; after NEM (filled circles), they were –33. 4 and 8.4, –43.7 and 7.5, –34. 5 and 10.3, and –55. 8 and 4.6 mV, respectively. The dotted curves in A–C are the fitted Boltzmann relations of the control data, scaled up so that maximal activation is equal to that of the post-NEM curve. E, Bars are mean V½ of KCNQ4, KCNQ5, KCNQ2, and KCNQ3 relations before (open) and after NEM (hatched). Student's t test, p < 0.05 in each group.
Figure 3.
Figure 3.
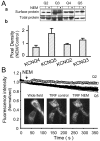
NEM does not induce trafficking of channels to the plasma membrane. A, Surface expression of homomeric myc-tagged KCNQ2–5 channels was evaluated by biotinylation labeling. Shown are the biotinylated proteins (top) and lysates (lower) after or without NEM treatment. B, Surface expression of homomeric YFP-tagged KCNQ2 and KCNQ5 evaluated by TIRF microscopy. Images are of two cells expressing YFP-tagged KCNQ5 under wide-field epifluorescence (left) or under TIRF illumination before (middle) or after (right) NEM treatment. Note the punctate membrane expression of the channels seen in the TIRF images. Plotted are the pooled data from all such experiments for YFP-tagged KCNQ2 (open circles; n = 7) and YFP-tagged KCNQ5 (filled circles; n = 4), by temporally aligning all experiments to NEM application. Images were acquired every 3 sec under constant bath perfusion, and surface expression was estimated by quantification of pixel intensity. Care was taken to not saturate the camera at any point in the image. NEM was bath-applied at the time shown by the arrow.
Figure 4.
Figure 4.
Single-channel properties of KCNQ4 and KCNQ5 channels. A, KCNQ4. a, Single (left) and ensemble (n = 52; right) records from a multichannel KCNQ4 cell-attached patch (left), using a typical M-current voltage protocol, as in Figure 1. b, Single sweeps at the holding potential of Vm = 0 mV applied to a cell-attached patch containing a single KCNQ4 channel before or after bath application of linopirdine (50 μm; bottom). Also shown is a representative segment of one sweep (as indicated) on a faster time scale. B, a, All-point amplitude histograms for the sweeps shown in A, fitted by a double-Gaussian curve (smooth lines). The closed-state peak has been set to 0 pA. The fitted single-channel amplitude (i) was 0.18 pA, and the Po was 0.07. b, Single-channel amplitudes (mean ± SEM) against a range of membrane potentials. The mean slope conductance obtained by fitting the points by a line was 2.1 ± 0.1 pS (n = 12). c, Mean Po against a range of Vm, fitted by a Boltzmann equation. The maximal Po, V½, and k were 0.07 ± 0.01, –18.8 ± 2.5 mV, and 9.4 ± 2.2 mV (n = 6), respectively. Po was estimated as described in Materials and Methods. C, D, Similar analyses for cell-attached patches containing several (C, a) or a single (C, b) KCNQ5 channels. D, a, The fitted single-channel amplitude and Po at 0 mV were 0.19 pA and 0.22, respectively. b, The fitted chord conductance was 2.2 ± 0.1 pS (n = 7). c, The PoVm curve yielded values for maximal Po, V½, and k of 0.19 ± 0.04, –19.6 ± 5.6 mV, and 11.1 ± 5.4 mV (n = 5), respectively. O and C represent the open-channel and closed-channel current level, respectively.
Figure 5.
Figure 5.
Single-channel properties of KCNQ2 and KCNQ3 channels. A, B, Similar analysis as in Figure 4 for a cell-attached patch containing a single KCNQ2 channel. B, a, The fitted unitary current amplitude and Po at 0 mV were 0.52 pA and 0.11, respectively. b, The fitted chord conductance was 6.5 ± 0.2 pS (n = 6). c, The PoVm curve for this one patch yielded values for V½ and k of –33.9 and 13.2 mV, respectively. C, D, Similar analysis for a cell-attached patch containing a single KCNQ3 channel. Linopirdine (50 μm; bottom) blocked but did not completely inhibit channel activity (as might be expected because it cannot directly access the channel as in whole-cell experiments). D, a, The fitted unitary current amplitude and Po at 0 mV were 0.63 pA and 0.90, respectively. b, The fitted chord conductance was 8.5±0.3 pS (n = 5). c, ThePoVm curve yielded values for maximal Po, V½, and k of 0.89 ± 0.08, –44.1 ± 3.9 mV, and 8.6 ± 3.5 mV (n = 6), respectively. O and C represent the open-channel and closed-channel current levels, respectively.
Figure 6.
Figure 6.
Singe-channel analysis of NEM action. A, Left, Current records at 0 mV from a cell-attached patch containing two KCNQ4 channels before and after bath application of 50 μm NEM. NEM increased the Po from 0.03 to 0.17. Linopirdine (50 μm) inhibited the openings in the patch. Middle, Mean Po against a range of Vm for KCNQ4 channels in the presence or absence of NEM, fitted by Boltzmann equations. Before NEM (open circles), the maximal Po, V½, and k were 0.07 ± 0.02, –18.8 ± 2.5 mV, and 9.4 ± 2.2 mV, respectively; after NEM (filled circles), they were 0.18 ± 0.02, –24.1 ± 4.8 mV, and 13.2 ± 4.0 mV, respectively. Right, Linear fits of current–voltage relationships of single KCNQ4 channels plotted as unitary current amplitudes against a range of Vm. The unitary conductance was not significantly changed by NEM, which was 2.1 ± 0.1 pS before NEM (open circles) and 2.0 ± 0.1 pS after NEM (filled circles) (n = 10). B, Similar analysis of NEM action on single KCNQ5 channels. Left, Current records of a single KCNQ5 channel at –10 mV in a cell-attached patch. Po increased from 0.1 (Control) to 0.5 (NEM). Middle, Mean Po versus Vm yielding values for maximal Po, V½, and k. Before NEM (open circles), they were 0.17 ± 0.03, –19.6 ± 5.6 mV, and 11.1 ± 5.4 mV, respectively; after NEM (filled circles), they were 0.58 ± 0.10, –44.1 ± 3.9 mV, and 8.6 ± 3.5 mV (n = 4), respectively. Right, Fitted chord conductances for KCNQ5 channels of 2.2±0.1 pS before NEM (open circles) and 2.0±0.2 pS after NEM (filled circles) (n = 7). C, Left, Similar analysis of NEM effect for a cell-attached patch containing a single KCNQ2 channel. NEM increased the Po from 0.12 to 0.38, and linopirdine (50 μm) reduced it to near zero. Middle, PoVm curves from the same patch yielded values for maximal Po, V½, and k of 0.36, –33.9 mV, and 13.2 mV, respectively, before NEM (open circles); after NEM (filled circles), they were 0.71, –54.9 mV, and 10.3 mV, respectively. Right, Fitted chord conductances of 6.2±0.3 pS before NEM (open circles) and 6.3 ± 0.4 pS after NEM (filled circles) (n = 4). O and C represent the open-channel and closed-channel current levels, respectively.
Figure 7.
Figure 7.
NEM augmentation is conferred by the C terminus of KCNQ3 or KCNQ4. A, Diagram of the KCNQ3N /4C chimera (top left), consisting of most of the KCNQ4 C terminus grafted onto the rest of KCNQ3. The thick bars in the N and C termini indicate regions strongly conserved among KCNQ1–5 channels. Plotted are families of currents and activation curves generated from their normalized tail current amplitudes before and after NEM application (top right, bottom left). The dotted line is the control curve scaled up to match the post-NEM curve, and the bars (bottom right) are mean V½ before and after NEM. The mean fitted V½ was –26.9 ± 2.8 mV (n = 5) in control, not significantly different from the V½ after NEM (–30.8 ± 2.8 mV; n = 5). B, Inverse KCNQ4N /3C chimera (left), consisting of the C terminus of KCNQ3 grafted onto the rest of KCNQ4. Right, Currents before and after NEM treatment from this chimera using a classical M-current protocol. The currents from this chimera were too small to generate meaningful activation curves. C, Bars are mean current densities of the two chimeras and of wt KCNQ3 and KCNQ4 for comparison. Those of KCNQ3N /4C and KCNQ4N /3C were 13.0 ± 3.5 and 4.6 ± 1.0 pA/pF (n = 6; p < 0.05), respectively. Those of wt KCNQ4 and KCNQ3 were 17.1 ± 5.1 and 3.0 ± 0.7 pA/pF (n = 7; p < 0.05), respectively. D, Bars are mean NEM-induced augmentations of current amplitudes of two chimeras (p < 0.001).
Figure 8.
Figure 8.
Single-channel analysis of NEM action on the KCNQ3/4 chimeras. A, Current records of a cell-attached patch containing a single KCNQ4N/3C channel at Vm =–10 mV before and after bath application of 50 μm NEM. The fitted Po values from Gaussian curves were 0.92 in control and 0.94 after NEM. B, Current records of a cell-attached patch containing two KCNQ3N/4C channels at Vm =–10 mV before and after bath application of 50 μm NEM. The fitted Po values from Gaussian curves were 0.014 in control and 0.09 after NEM. O and C represent the open-channel and closed-channel current levels, respectively.
Figure 9.
Figure 9.
The C519A mutation abolishes most of NEM augmentation of KCNQ4 currents. A, Whole-cell currents from a cell transfected with KCNQ4 C519A, elicited by a family of voltage steps in 10 mV increments from –80 to 50 mV before and after bath application of NEM. B, Activation curves generated by tail current analysis of currents like those in A, fitted by Boltzmann equations. The fitted values of V½ and k were –21.0 ± 1.2 and 10.0 ± 0.7 mV (n = 6) in control (open circles) and –19.3 ± 1.1 and 9.8 ± 0.8 mV (n = 6) after application of 50 μm NEM (filled circles). C, Sweeps at Vm = 0 mV from a cell-attached patch containing at least two KCNQ4 C519A channels before and after application of 50 μm NEM. The mean Po values of 22 similar sweeps were 0.11 in control and 0.14 after NEM application. O and C represent the open-channel and closed-channel current levels, respectively. D, Bars are mean augmentations by NEM of currents from wt KCNQ4 and three cysteine-to-alanine mutants. For wild-type KCNQ4, C519A, C427A, and C418A, they were 2.9 ± 0.4 (n = 7), 1.4 ± 0.1 (n = 14), 2.2 ± 0.2 (n = 4), and 2.5 ± 1.0 (n = 4), respectively. **p < 0.01.

Similar articles

Cited by

References

    1. Axelrod D (2003) Total internal reflection fluorescence microscopy in cell biology. Methods Enzymol 361: 1–33. - PubMed
    1. Axelrod D, Burghardt TP, Thompson NL (1984) Total internal reflection fluorescence. Annu Rev Biophys Bioeng 13: 247–268. - PubMed
    1. Barhanin J, Lesage F, Guillemare E, Fink M, Lazdunski M, Romey G (1996) K(V)LQT1 and lsK (minK) proteins associate to form the IKs cardiac potassium current. Nature 384: 78–80. - PubMed
    1. Cooper EC, Harrington E, Jan YN, Jan LY (2001) M channel KCNQ2 subunits are localized to key sites for control of neuronal network oscillations and synchronization in mouse brain. J Neurosci 21: 9529–9540. - PMC - PubMed
    1. del Camino D, Holmgren M, Liu Y, Yellen G (2000) Blocker protection in the pore of a voltage-gated K+ channel and its structural implications. Nature 403: 321–325. - PubMed

Publication types

MeSH terms

Substances

LinkOut - more resources