. 2004 Jun 2;24(22):5109-18.
doi: 10.1523/JNEUROSCI.0235-04.2004.

A cholinergic synaptically triggered event participates in the generation of persistent activity necessary for eye fixation

Affiliations

A cholinergic synaptically triggered event participates in the generation of persistent activity necessary for eye fixation

Juan de Dios Navarro-López et al. J Neurosci. .

Abstract

An exciting topic regarding integrative properties of the nervous system is how transient motor commands or brief sensory stimuli are able to evoke persistent neuronal changes, mainly as a sustained, tonic action potential firing. A persisting firing seems to be necessary for postural maintenance after a previous movement. We have studied in vitro and in vivo the generation of the persistent neuronal activity responsible for eye fixation after spontaneous eye movements. Rat sagittal brainstem slices were used for the intracellular recording of prepositus hypoglossi (PH) neurons and their synaptic activation from nearby paramedian pontine reticular formation (PPRF) neurons. Single electrical pulses applied to the PPRF showed a monosynaptic glutamatergic projection on PH neurons, acting on AMPA-kainate receptors. Train stimulation of the PPRF area evoked a sustained depolarization of PH neurons exceeding (by hundreds of milliseconds) stimulus duration. Both duration and amplitude of this sustained depolarization were linearly related to train frequency. The train-evoked sustained depolarization was the result of interaction between glutamatergic excitatory burst neurons and cholinergic mesopontine reticular fibers projecting onto PH neurons, because it was prevented by slice superfusion with cholinergic antagonists and mimicked by cholinergic agonists. As expected, microinjections of cholinergic antagonists in the PH nucleus of alert behaving cats evoked a gaze-holding deficit consisting of a re-centering drift of the eye after each saccade. These findings suggest that a slow, cholinergic, synaptically triggered event participates in the generation of persistent activity characteristic of PH neurons carrying eye position signals.


Figures

Figure 9.
Figure 9.
Time course of the effects on horizontal eye movements of ipsilateral injections in the PH nucleus of nonspecific and specific M1 receptor agonists and antagonists. Data plotted in the panels were collected from a representative injection of each drug. Each point represents (as a percentage of the maximum value) the velocity of the slow phase of the nystagmus (A, inset) for carbachol (A, •) and McN-A-343 (B, •) in complete darkness, or the area (C, inset) of missed eye position during the first 0.6 sec after a saccade for atropine (C, ▴) and pirenzepine (D, ▴) in light. Calibrations are as indicated.
Figure 1.
Figure 1.
Diagrams of stimulation and recording sites. A, A diagram illustrating the circuits present in the sagittal brainstem slice used in this study. Excitatory burst neurons (EBN) are located in the PPRF and project monosynaptically on abducens motoneurons (ABD Mn) and on PH neurons. Stimuli applied to the PPRF also activate descending cholinergic axons from pontomesencephalic areas. See Results for details and references. B, A photomicrograph of a PH neuron stained after intracellular recording. C, A drawing showing the reconstruction of the neuron illustrated in B. This neuron type corresponds to a principal cell (McCrea and Baker, 1985a). The two small arrows indicate initial trajectory of the axon. Scale bars: B, C, 50 μm. NVM, Medial vestibular nucleus.
Figure 2.
Figure 2.
Differential effects of single and train stimulation of PPRF on PH neurons. A, A representative example of typical action potentials recorded from PH neurons. Note the characteristic biphasic appearance of the AHP. B, Graded EPSPs evoked in the same PH neuron by single-pulse (100 μsec) stimulation of the PPRF at increasing intensities (200–400 μA) until threshold intensity for action potential was reached. C, D, Effects of PPRF train (200 Hz, 250μA) stimulation on two PH cells. Note the large and sustained depolarization after the end of the burst stimuli. Calibration is the same for C and D. E, F, Plots of train frequency during PPRF stimulation (in Hertz) against the amplitude (E) and duration (F) of the depolarizing potential evoked by the train (n = 8). Values for amplitude (a) and duration (b) were measured as indicated in C.
Figure 3.
Figure 3.
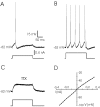
Response of PH neurons to DC injection. A, A single action potential evoked in a PH neuron with a depolarizing current pulse (0.2 nA, 200 msec). B, A train of action potentials evoked in the same neuron when the current pulse was increased to 0.5 nA. Note the absence of any plateau potential after neuron depolarization by DC injection. C, Example of the response of the same PH neuron after superfusion with TTX (1 μm) in the presence of a depolarizing pulse of 0.4 nA. D, Current–voltage (I–V) relationships for a PH neuron in which voltage-dependent sodium currents were blocked with TTX (1 μm). The resting membrane potential for the neuron was –60 mV. Current pulses were always 200 msec in duration.
Figure 4.
Figure 4.
Glutamatergic nature of PPRF synapses on PH neurons and the depolarizing effect of cholinergic inputs on the same postsynaptic neuron. A, Top, EPSP evoked in a PH neuron by a single subthreshold stimulus applied to the PPRF. Note that the synaptic potential was not affected by atropine (1.5 μm) but that superfusion with CNQX (10 μm) completely removed the evoked EPSP. B, Train (200 Hz) stimulation of the same PPRF site evoked a large and sustained post-train depolarization of the same PH neuron. This sustained depolarization was impossible to evoke in the presence of atropine sulfate (1.5 μm).
Figure 5.
Figure 5.
Depolarizing effects of carbachol on PH neurons. A, Intracellular recording of a PH neuron in the presence of carbachol (25 μm). Note a slow depolarization of the recorded cell with a nonsignificant decrease in membrane input resistance. At threshold, the neuron started the generation of action potentials. The depolarizing effect of carbachol disappeared after the cell was washed with the bathing solution. The arrows indicate the points at which recordings were expanded in time to show membrane potential during the presentation of hyperpolarizing pulses (0.3 nA, 300 msec). The dotted line indicates the membrane resting potential. The maximum depolarizing level evoked by carbachol is indicated (Vmax). B, C, The depolarizing effects of carbachol were blocked by atropine (1.5 μm) and by pirenzepine (0.5 μm). Maximum depolarizing levels evoked by carbachol in B and C are indicated (Vmax). In C, hyperpolarizing current pulses (0.3 nA, 300 msec) were presented at a frequency of 0.2 Hz. D, A plot of membrane potential (Vm, in millivolts) against neuron firing rate (spikes/second) for data shown in C. The continuous line indicates firing frequencies reached when membrane potential was changing in the depolarizing direction. The dotted line indicates neuron firing when the membrane potential was going in the hyperpolarizing direction. Vmax, Maximum membrane potential evoked by carbachol superfusion. Calibration is the same for AC.
Figure 6.
Figure 6.
Postsynaptic depolarizing effects of carbachol on PH neurons. A, An example of the experimental protocol. A hyperpolarizing current pulse (0.3 nA, 300 msec; at a frequency of 0.2 Hz) was presented 300 msec in advance of a subthreshold stimulus applied to the PPRF to evoke an EPSP in the postsynaptic PH neuron. B, The addition of TTX (1 μm) to the bath removed EPSPs because of action potential blocking. The asterisk indicates that the cell was not responsive to intracellular current injection. In this situation, superfusion with carbachol (25 μm) evoked a noticeable depolarization of the membrane potential, with no evident change in the input resistance of the recorded neuron. The maximum depolarizing level evoked by carbachol is indicated (Vm). The depolarizing effect of carbachol disappeared after the cell was washed with the bathing solution. Washing also allowed the reappearance of EPSPs evoked by PPRF stimulation. The arrows indicate the points at which recordings were expanded in time to show EPSPs evoked by PPRF stimulation and membrane potential during the presentation of hyperpolarizing pulses. The dotted line indicates the membrane resting potential. Vm, Maximum membrane potential evoked by carbachol superfusion.
Figure 7.
Figure 7.
EPSPs evoked in PH neurons by paired pulses presented to the PPRF and their presynaptic modulation by carbachol and other cholinergic drugs. A, Sample of EPSP records evoked by paired stimuli (S1–S2; interval, 70 msec) presented to the ipsilateral PPRF in the control condition (row 1) and during caconitine (row 2; 0.1 μm), caconitine plus carbachol (row 3; 25 μm), and caconitine plus carbachol plus atropine (row 4; 1.5 μm). Note that carbachol depressed S1- and S2-evoked EPSPs and that the effect was reversed by atropine. Membrane potential of the postsynaptic PH neuron was maintained at its resting level by current injection to cancel out the postsynaptic depolarization evoked by carbachol. B, Superimposition of EPSPs obtained by S1 (black recordings) and S2 (gray recordings) stimuli shown in A. C, Histograms with mean values for EPSP amplitude (in millivolts; n = 10) obtained for S1 presentations. D, Paired-pulse depression (PPD) test. Histograms with mean values (in millivolts; n = 10) obtained for the equation %PPD = S2/S1 × 100, indicating a significant recovery, evoked by carbachol, of the depression induced by the second stimulus (S2). These results suggested a presynaptic action of carbachol.
Figure 8.
Figure 8.
Recordings of left eye position in the vertical (VP) and horizontal (HP) planes obtained in the alert cat in complete darkness (gray lane) and in light, after the injection in the left PH of the indicated drugs. Doses and times after injection were: carbachol (B): 1.5 pmol, 12.8 min; McN-A-343 (D): 20 pmol, 4.5 min; atropine (A): 8 mmol, 20.3 min; pirenzepine (C): 0.12 pmol, 4.9 min. Eye position is plotted as degrees of rotation in the horizontal plane, positive to the left (l) and up (u) and negative to the right (r) and down (d). The zero (0) indicates the central position of the eye in the orbit. The curved and straight arrows indicate the characteristics of eye movement induced by the drugs.

Similar articles

Cited by

References

    1. Aksay E, Baker R, Seung HS, Tank DW (2000) Anatomy and discharge properties of premotor neurons in the goldfish medulla that have eye-position signals during fixations. J Neurophysiol 84: 1035–1049. - PubMed
    1. Aksay E, Gamkrelidze G, Seung HS, Baker R, Tank DW (2001) In vivo intracellular recording and perturbation of persistent activity in a neuronal integrator. Nat Neurosci 4: 184–193. - PubMed
    1. Aksay E, Baker R, Seung HS, Tank DW (2003) Correlated discharge among cell pairs within the oculomotor horizontal velocity-to-position integrator. J Neurosci 23: 10852–10858. - PMC - PubMed
    1. Arnold DB, Robinson DA, Leigh RJ (1999) Nystagmus induced by pharmacological inactivation of the brainstem ocular motor integrator in monkey. Vision Res 39: 4286–4295. - PubMed
    1. Barmack NH, Baughman RW, Eckenstein FP, Shojaku H (1992) Secondary vestibular cholinergic projection to the cerebellum of rabbit and rat as revealed by choline acetyltransferase immunohistochemistry, retrograde and orthograde tracers. J Comp Neurol 317: 250–270. - PubMed

Publication types

MeSH terms