. 2004 Jun 2;24(22):5162-71.
doi: 10.1523/JNEUROSCI.4979-03.2004.

Dopamine modulates use-dependent plasticity of inhibitory synapses

Affiliations

Dopamine modulates use-dependent plasticity of inhibitory synapses

Dinara V Baimoukhametova et al. J Neurosci. .

Abstract

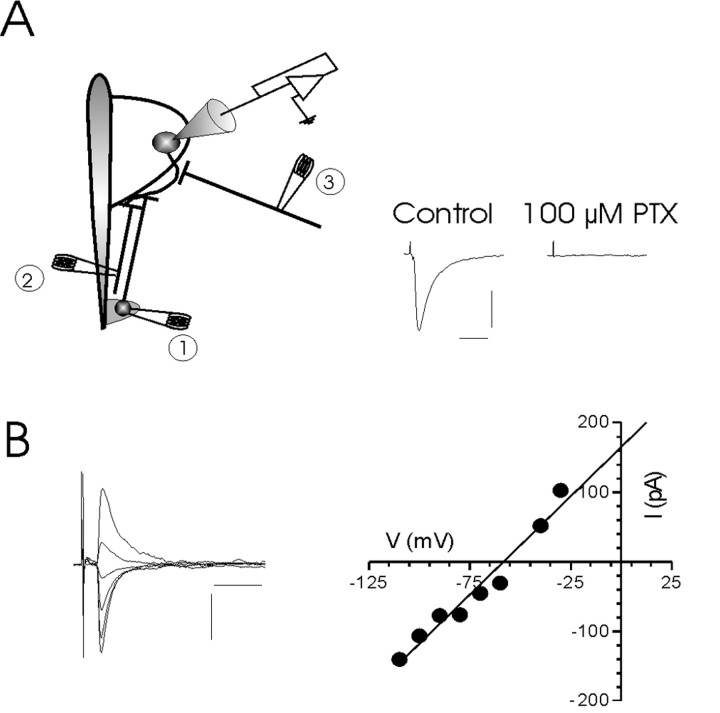
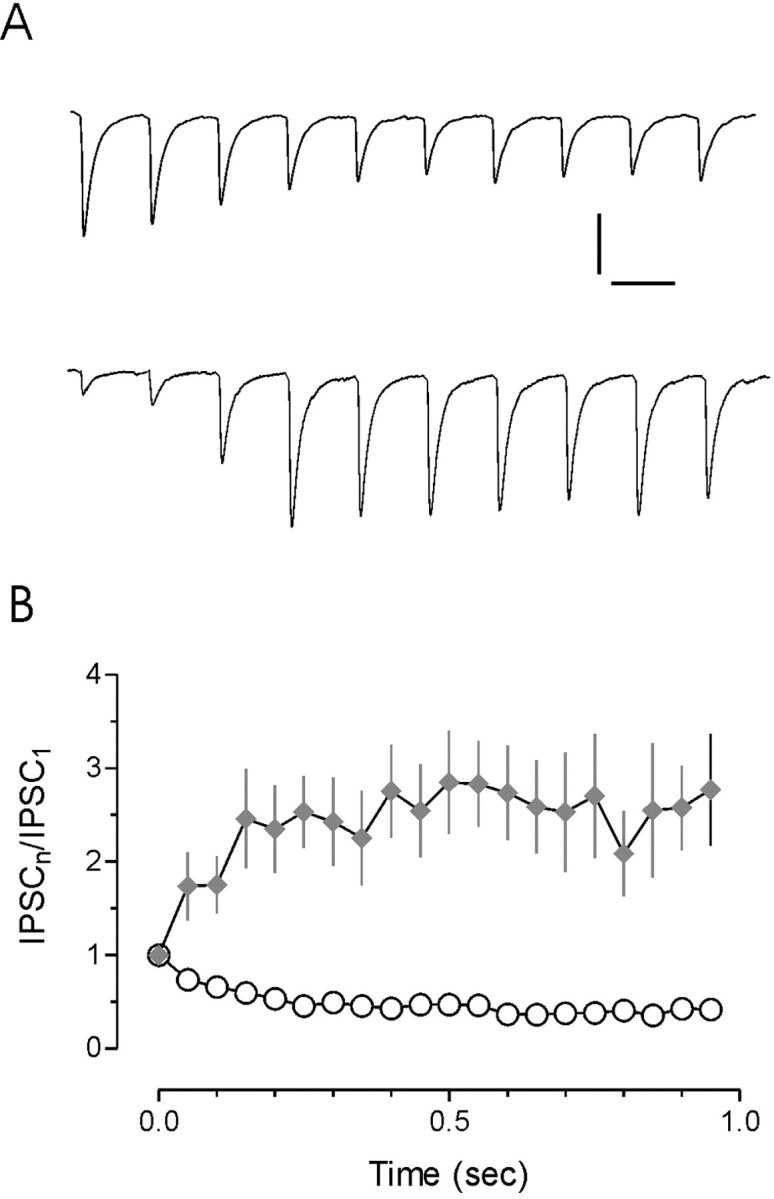
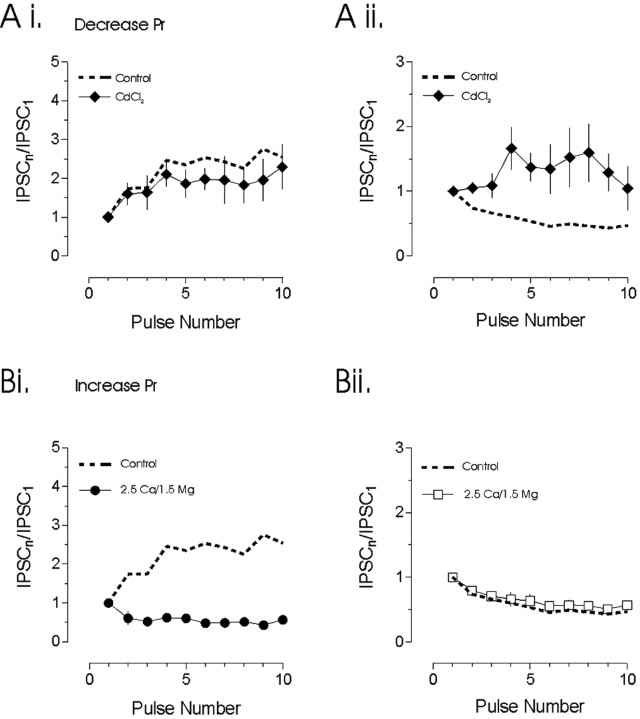
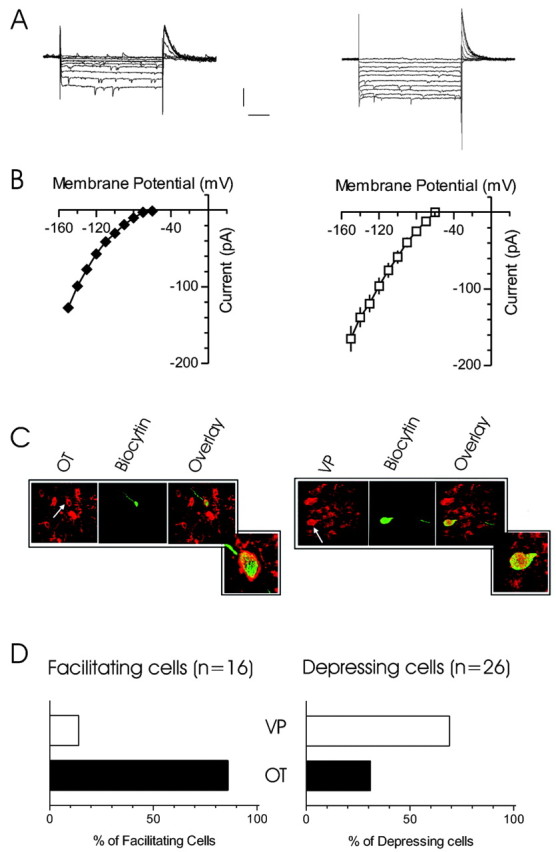
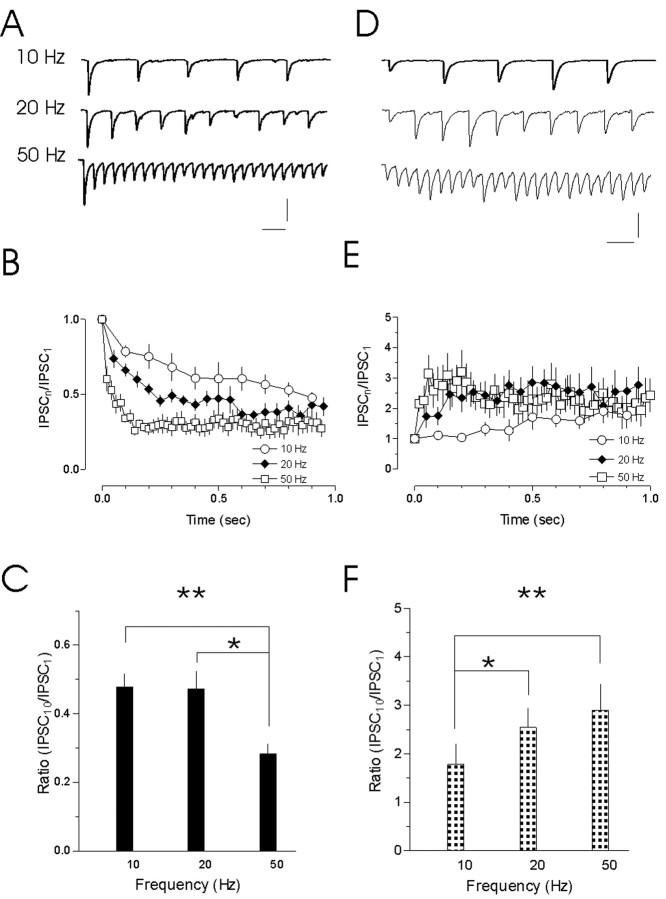
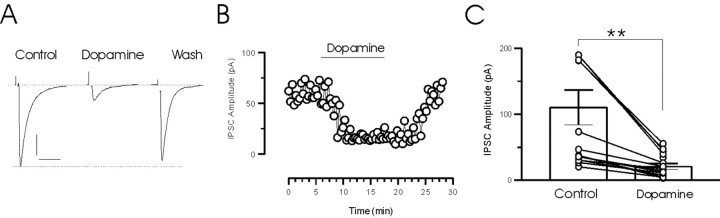
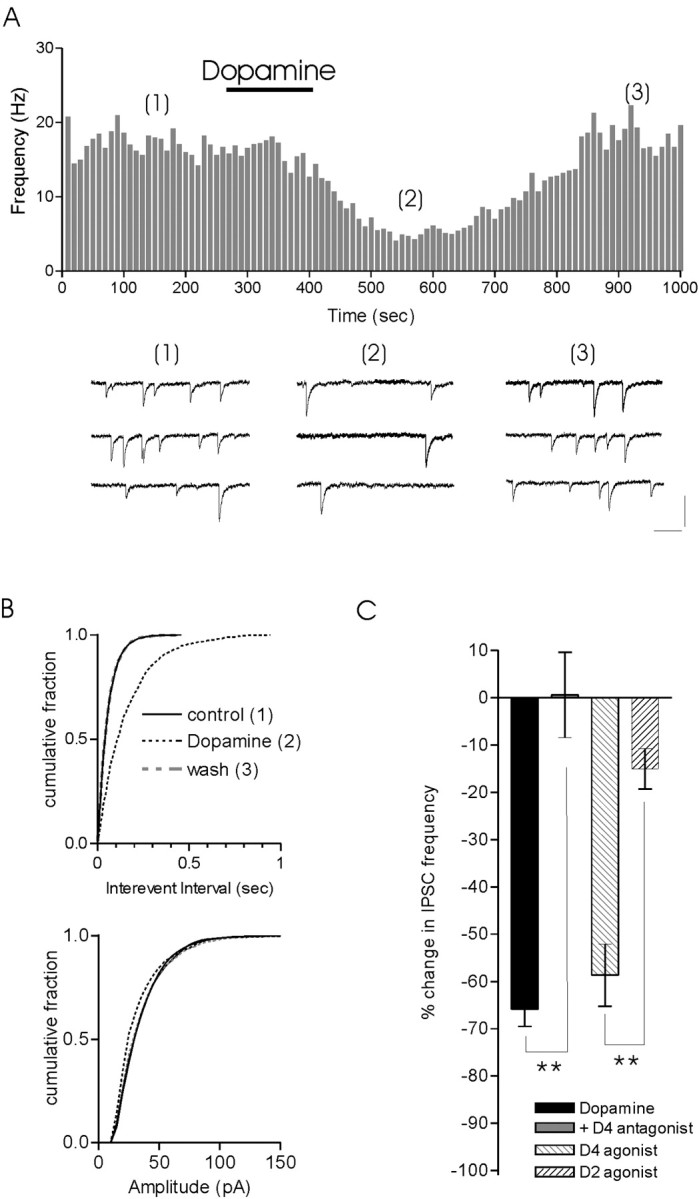
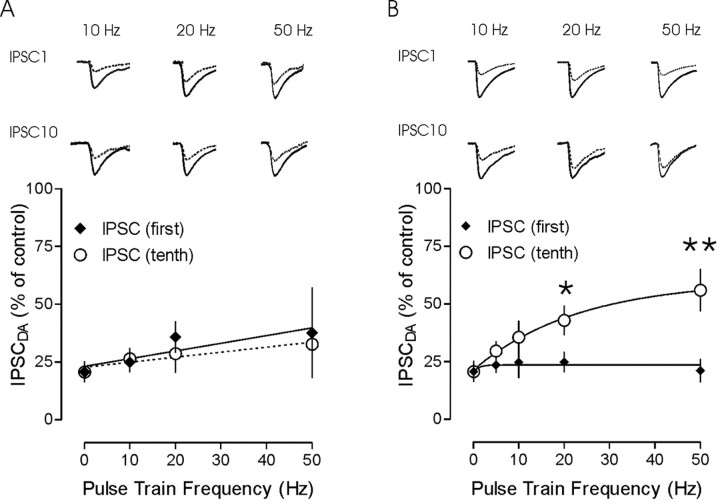
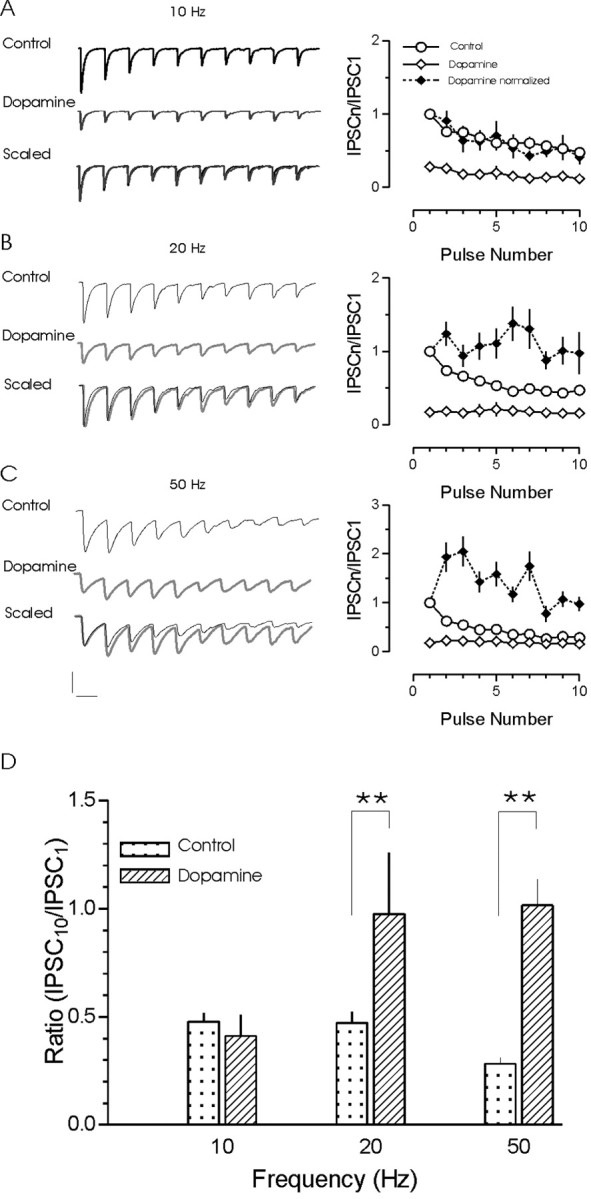
The release of the hormones oxytocin (OT) and vasopressin (VP) into the circulation is dictated by the electrical activity of hypothalamic magnocellular neurosecretory cells (MNCs). In the paraventricular nucleus of the hypothalamus (PVN), MNC neuronal activity is exquisitely sensitive to changes in input from inhibitory GABAergic synapses. To explore the hypothesis that efficacy at these synapses is dictated by the rate at which a given synapse is activated, we obtained whole-cell recordings from MNCs in postnatal day 21-27 male Sprague Dawley rat brain slices. IPSCs were elicited by electrically stimulating GABAergic projections from either the suprachiasmatic nucleus or putative interneuron populations immediately ventral to the fornix at 5, 10, 20, and 50 Hz. Short-term plasticity was observed at 88% of the synapses tested. Of this group, synaptic depression was observed in 58%, and synaptic facilitation was observed in 41%. Identification of cells using a combined electrophysiological and immunohistochemical approach revealed a strong correlation between cell phenotype and the nature of the plasticity. Short-term facilitation was observed preferentially in OT cells (86%), whereas short-term depression was predominant in VP neurons (69%). We next examined the effects of dopamine, which increases MNC excitability, on short-term plasticity. Activation of presynaptic D(4) receptors decreased the frequency of miniature IPSCs and prevented the development of synaptic depression at higher rates of activity. Synaptic facilitation, however, was unaffected by dopamine. These findings demonstrate that, by lowering GABA release probability, dopamine confers high-pass filtering properties to the majority of inhibitory synapses onto MNCs in PVN.


Figures

Figure 1.
Figure 1.
Evoked GABAergic IPSCs in PVN MNCs. A, Schematic depicts experimental configuration with three different stimulating electrode positions. Electrical stimulation in any of the three regions elicits a monosynaptic IPSC in MNCs (shown on right). The complete abolition of the synaptic event by 100 μm picrotoxin confirms that it is mediated by GABAA receptors. B, Evoked synaptic currents at different postsynaptic membrane potentials are shown. Plotting the current (peak)–voltage relationship reveals a reversal potential of –58 mV. Calibration: A, 50 pA, 5 msec; B, 100 pA, 10 msec.
Figure 2.
Figure 2.
Non-uniform responses to stimulation at physiological frequency. A, Representative traces of synaptic responses evoked by pulse trains of 20 Hz in two different magnocellular neurons. Short-term plasticity was observed in 88% of all synapses tested. In the majority of these cells, short-term synaptic depression was observed (58%; n = 50 of 87; top trace). Synaptic facilitation was observed in 41% of the cells tested (n = 36 of 87; bottom trace). B, Summary of synaptic facilitation and depression at 20 Hz is plotted with respect to time. Calibration: 50 pA, 50 msec.
Figure 3.
Figure 3.
Plasticity during trains is dictated by release probability. Release probability was decreased by adding 10 μm CdCl2 to the bath or increased by manipulating the Ca2+/Mg2+ ratio. A, Decreasing the Pr had no effect on the development of synaptic facilitation (Ai) in four cells tested. In contrast, synaptic depression (Aii) was attenuated (n = 4). B, Increasing Pr prevented the development of synaptic facilitation (Bi). After this manipulation, synapses were seen to depress rather than facilitate (n = 4). In contrast, increasing Pr had no effect on the development of synaptic depression (Bii). The dashed lines represent mean facilitation and depression plots obtained from Figure 2.
Figure 4.
Figure 4.
Relationship of synaptic response with cell phenotype. A, Voltage-clamp records show currents evoked by hyperpolarizing current steps in two different cells. The cells were held at –40 mV and subjected to 10 mV, 500 msec steps. The sharp downward deflections evident in the current traces are spontaneous synaptic events. The cell on the left exhibits a prominent inward rectification at negative potentials, and the cell on the right shows no rectification. B, I–V plots from these two cell types demonstrate the relationship between membrane potential and whole-cell current. C, Immunohistochemical examination demonstrates that cells with rectifying I–V relationships (left) are immunopositive for OT, whereas cells with linear I–V relationships (right) are immunopositive for VP. D, Analysis of cell phenotype and synaptic response to pulse trains demonstrates that OT was the predominant phenotype for cells in which facilitation was observed (13 of 16; 86%). In contrast, the VP phenotype was observed in the majority of cells in which depression was evident (18 of 26; 69%). Calibration: 100 pA, 100 msec.
Figure 5.
Figure 5.
Plasticity of transmission at different stimulation frequencies. A, Traces show representative examples of synaptic depression evoked in response to synaptic stimulation at 10, 20, and 50 Hz. The extent of the depression is quantified below (B). The depression is frequency dependant, developing more quickly at higher rates of activity. C, A comparison of the relative IPSC evoked by the 10th pulse at each of the three frequencies. Fractionally greater depression was observed at 50 Hz (*p < 0.05 vs 20 Hz; **p < 0.01 vs 10 Hz). D, Traces show representative examples of synaptic facilitation evoked in response to 10, 20, and 50 Hz stimulation. The facilitation is frequency dependant (compare 10 with 20 Hz), but, as is clear in E, there appears to be a saturation of the response at higher frequencies. F, A plot of the relative IPSC frequencies demonstrates greater facilitation at 20 and 50 Hz compared with 10 Hz (*p < 0.05 and **p < 0.01, respectively). No difference was evident when comparing between IPSC10 at 20 and 50 Hz. Calibration: 50 pA, 50 msec.
Figure 6.
Figure 6.
Dopamine reversibly depresses evoked IPSCs. A, Voltage-clamp traces (each is an average of 20 individual synaptic responses) demonstrate the effect of dopamine and the subsequent recovery of the response. B, The effect of dopamine on IPSC amplitude with respect to time is shown. Bath application of dopamine (100 μm) reversibly depresses IPSC amplitude. C, Summary graph of dopamine effects on IPSC amplitude. The responses of individual cells are superimposed on the bar graph. IPSC amplitude decreased from 110.3 ± 26.2 to 20.7 ± 4.5 pA (n = 16; **p < 0.01). Calibration: 25 pA, 25 msec.
Figure 7.
Figure 7.
Dopamine effects are presynaptic. A, Bath application of dopamine (100 μm) reversibly decreases the frequency of mIPSCs. Representative traces from control, dopamine, and wash are shown below. B, Quantification of this data demonstrates a significant increase in the interevent interval (Kolmogorov–Smirnov statistic; p < 0.01) but no change in amplitude. C, Bar graph summarizes effects of dopamine that are blocked by the D4 antagonist L-745,870 (50 μm) and mimicked by the D4 receptor agonist PD168077 (30 μm) but not the D2 receptor agonist quinpirole (90 μm). Calibration: 20 pA, 100 msec.
Figure 8.
Figure 8.
Dopamine depresses synaptic responses uniformly only in facilitating trains. A, A comparison of relative synaptic depression of the 1st and 10th IPSCs observed in response to dopamine at different stimulation frequencies. Traces show the 1st and 10th control IPSCs at 10, 20, and 50 Hz (solid line) and the IPSC in dopamine (dotted line) in cells in which synaptic facilitation was observed. The plot below demonstrates relatively little effect of stimulation frequency on the relative amount of depression by dopamine. B, IPSCs are compared in a cell that exhibited synaptic depression in response to a high-frequency stimulation train. The plot of the fractional IPSC in dopamine with respect to stimulation frequency demonstrates that the effects of dopamine are non-uniform. A greater fraction of the IPSC remains (less inhibition by dopamine) at the tail end of synaptic response in high-frequency trains. To facilitate comparison, all control traces have been peak scaled to the same amplitude. The traces in dopamine have also been scaled to represent the relative depression. All traces depicted are the average of 14–20 responses. *p < 0.05; **p < 0.01.
Figure 9.
Figure 9.
Dopamine prevents the development of use-dependent depression at higher rates of activity. Representative traces of synaptic responses evoked by pulse trains of 10 (A), 20 (B), and 50 (C) Hz in control (top trace) and dopamine (middle trace). The first IPSCs in each trace were scaled, and the traces were then overlaid (bottom). Plots of the effect of dopamine on pulse-train depression at 10 Hz (n = 3), 20 Hz, and 50 Hz (n = 8) are shown on the right. Dopamine depresses individual IPSCs at all stimulation frequencies tested and alters the development of depression during the 20 and 50 Hz trains. A shift from depression to facilitation is evident as stimulation frequency is increased. D, Summary graph of the ratio of IPSC10 to IPSC1 at each of the three different frequencies tested. The ratio increased during the 20 and 50 Hz trains by dopamine (**p < 0.01). Calibration: A, 50 pA, 100 msec; B, 50 pA, 50 msec; C, 50 pA, 20 msec.

Similar articles

Cited by

References

    1. Aggelopoulos NC, Meissl H (2000) Responses of neurones of the rat suprachiasmatic nucleus to retinal illumination under photopic and scotopic conditions. J Physiol (Lond) 523: 211–222. - PMC - PubMed
    1. Azdad K, Piet R, Poulain DA, Oliet SH (2003) Dopamine D4 receptor-mediated presynaptic inhibition of GABAergic transmission in the rat supraoptic nucleus. J Neurophysiol 90: 559–565. - PubMed
    1. Bains JS, Ferguson AV (1997) Nitric oxide regulates NMDA-driven GABAergic inputs to type I neurones of the rat paraventricular nucleus. J Physiol (Lond) 499: 733–746. - PMC - PubMed
    1. Bertram R, Arnot MI, Zamponi GW (2002) Role for G protein Gbeta-gamma isoform specificity in synaptic signal processing: a computational study. J Neurophysiol 87: 2612–2623. - PubMed
    1. Bertram R, Swanson J, Yousef M, Feng ZP, Zamponi GW (2003) A minimal model for G protein-mediated synaptic facilitation and depression. J Neurophysiol 90: 1643–1653. - PubMed

Publication types

MeSH terms

LinkOut - more resources