. 2004 Jun 17;429(6993):771-6.
doi: 10.1038/nature02583. Epub 2004 Jun 2.

Sirt1 promotes fat mobilization in white adipocytes by repressing PPAR-gamma

Affiliations

Sirt1 promotes fat mobilization in white adipocytes by repressing PPAR-gamma

Frédéric Picard et al. Nature. .

Erratum in

  • Nature. 2004 Aug 19;430(7002):921

Abstract

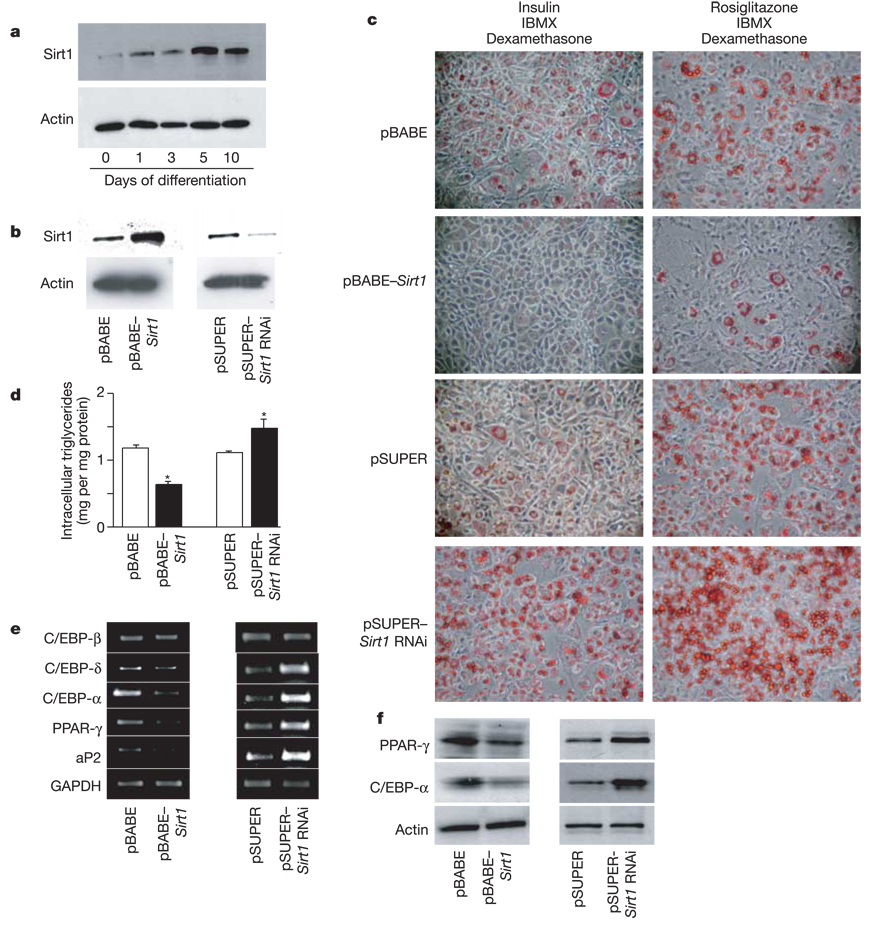
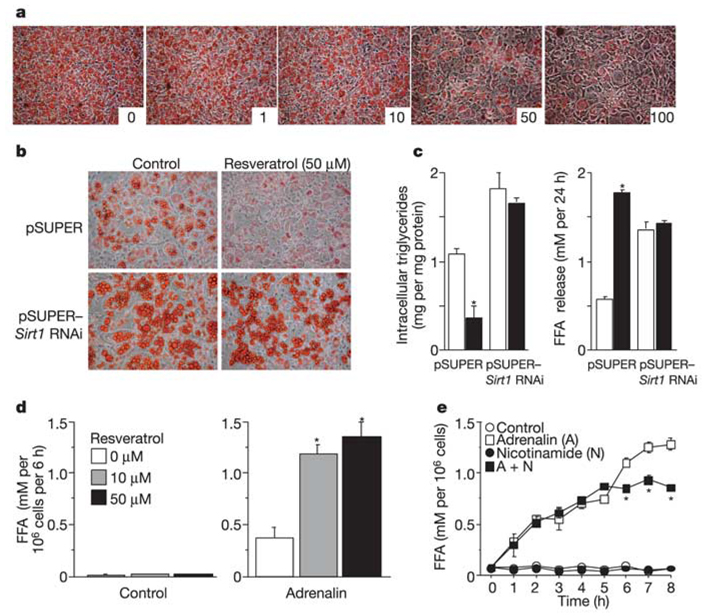
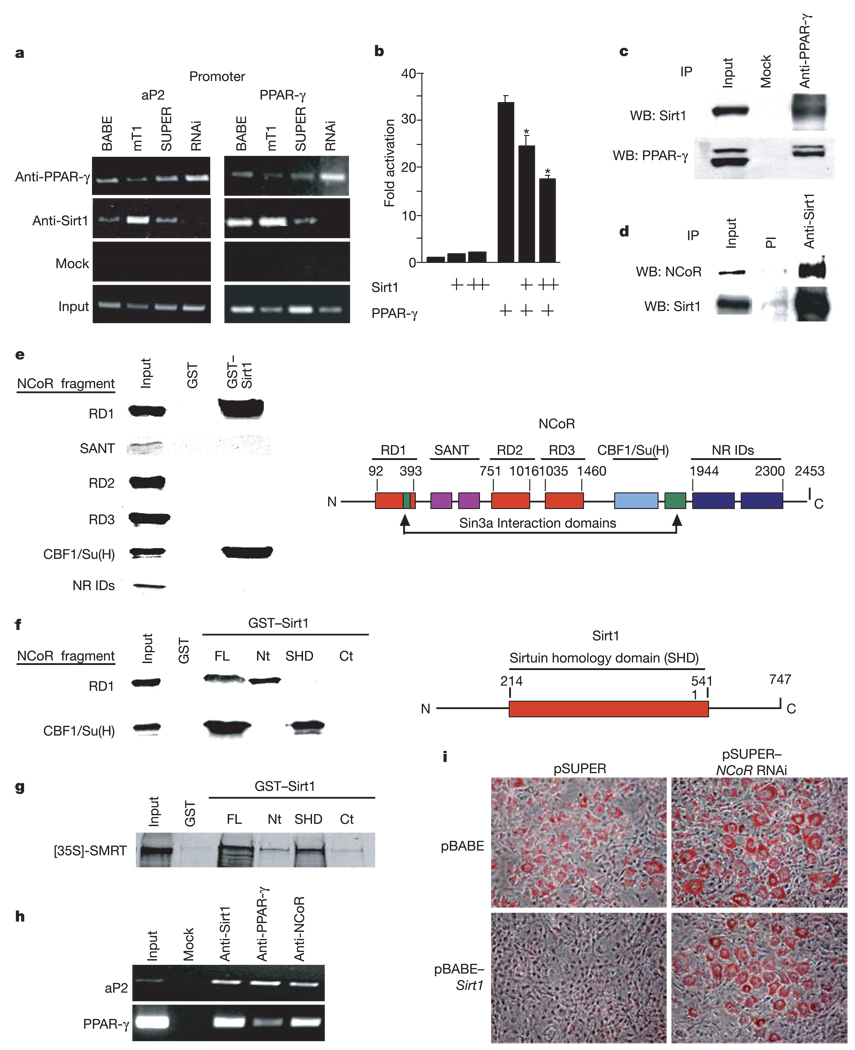
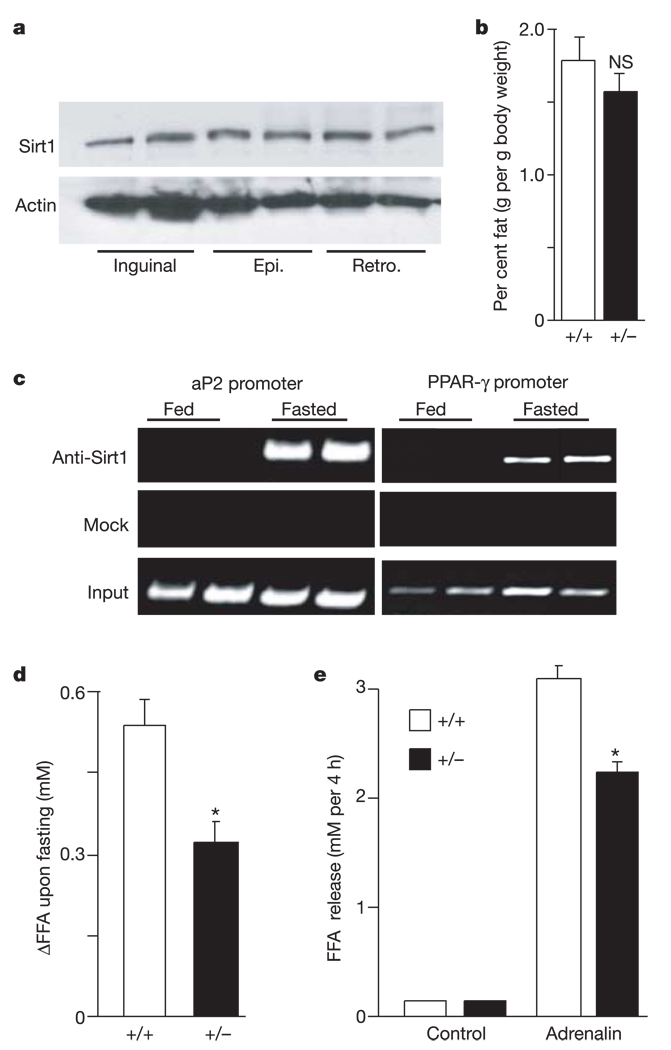
Calorie restriction extends lifespan in organisms ranging from yeast to mammals. In yeast, the SIR2 gene mediates the life-extending effects of calorie restriction. Here we show that the mammalian SIR2 orthologue, Sirt1 (sirtuin 1), activates a critical component of calorie restriction in mammals; that is, fat mobilization in white adipocytes. Upon food withdrawal Sirt1 protein binds to and represses genes controlled by the fat regulator PPAR-gamma (peroxisome proliferator-activated receptor-gamma), including genes mediating fat storage. Sirt1 represses PPAR-gamma by docking with its cofactors NCoR (nuclear receptor co-repressor) and SMRT (silencing mediator of retinoid and thyroid hormone receptors). Mobilization of fatty acids from white adipocytes upon fasting is compromised in Sirt1+/- mice. Repression of PPAR-gamma by Sirt1 is also evident in 3T3-L1 adipocytes, where overexpression of Sirt1 attenuates adipogenesis, and RNA interference of Sirt1 enhances it. In differentiated fat cells, upregulation of Sirt1 triggers lipolysis and loss of fat. As a reduction in fat is sufficient to extend murine lifespan, our results provide a possible molecular pathway connecting calorie restriction to life extension in mammals.


Figures

Figure 1
Figure 1
Sirt1 regulates adipogenesis and triglyceride accumulation in 3T3-L1 cells. a, Time course of Sirt1 protein expression on a western blot in 3T3-L1 cells upon induction of adipogenesis. b, Sirt1 protein levels in 3T3-L1 cells infected with control pBABE or pSUPER retroviral vectors or with pBABE–Sirt1 or pSUPER–Sirt1 RNAi vectors for overexpression or downregulation of Sirt1, respectively. c, Oil red O staining for triglycerides in infected 3T3-L1 cells differentiated for 7 days with IBMX and dexamethasone plus either insulin or rosiglitazone. d, Intracellular triglyceride levels in infected 3T3-L1 cells differentiated for 7 days with insulin, IBMX and dexamethasone. Data shown are means + s.e.m. and were obtained from two independent experiments carried out in triplicate. Asterisk indicates a statistical difference from respective control (P < 0.05). e, f, 3T3-L1 cells were infected and differentiated as in d. Protein and total RNA were extracted at day 7. e, Reverse transcription and PCRs were on complementary DNAs with gene-specific primers. One microgram of total RNA was used in each case. f, Protein levels of PPAR-γ and C/EBP-α in total cell extracts measured by western blotting. GAPDH and actin levels are shown as loading controls.
Figure 2
Figure 2
Activation of Sirt1 by resveratrol decreases fat accumulation in differentiated adipocytes. a, Resveratrol addition to 3T3-L1 cells first fully differentiated into adipocytes. At day 12, resveratrol dissolved in DMSO was added in increasing concentrations (1, 10, 50 and 100 µM; as indicated) and Oil red O staining was performed 3 days later and compared with cells incubated with DMSO alone (resveratrol 0 µM). b, c, Effect of resveratrol on 3T3-L1 cells infected with the indicated viruses. Cells were differentiated into adipocytes as in Fig. 1d. At day 12, resveratrol (50 µM) was added and 3 days later, intracellular triglyceride content was evaluated by Oil red O staining (b) and in cell lysates (c). FFA released in the medium during the 3-day incubation period was also measured (c). Open bars, control; filled bars, resveratrol. d, e, Effect of resveratrol on primary adipocytes isolated from rat retroperitoneal WAT. Cells were incubated with or without adrenalin (10−7 and 10−5 M for d and e, respectively) in the presence of Sirt1 activator (resveratrol, d) or inhibitor (nicotinamide, e). FFA levels released in the medium were measured after 4 h (d) or at indicated time points (e). Data shown are means ± s.e.m. and were obtained from two independent experiments done in triplicate. Asterisk indicates a statistical difference from respective control (P < 0.05).
Figure 3
Figure 3
Sirt1 reduces fat accumulation by repressing PPAR-γ activity through Sirt1–NCoR interactions. a, ChIP assays on 3T3-L1 cells infected as in Fig. 1c. Cells were differentiated for 7 days and assayed (Methods). b, Luciferase assays of 293T cells transfected with mouse PPAR-γ2 and pGL3–PPRE and with increasing concentrations of mouse Sirt1. Luciferase was measured 24 h later and was corrected for transfection efficiency. Data represent mean + s.e.m. of triplicate experiments carried out in duplicate. Asterisk indicates a statistical difference (P < 0.05). c, Co-immunoprecipitation of endogenous PPAR-γ and Sirt1 proteins in whole-cell extracts prepared from uninfected differentiated 3T3-L1 adipocytes. d, Co-immunoprecipitation of endogenous Sirt1 and NCoR proteins in HEK293 whole-cell extracts using pre-immune (PI) or anti-Sirt1 serum. e, Mapping the Sirt1 interaction interface of NCoR. Constructs encoding the indicated NCoR fragments were 35S-methionine-translated and used for GST pull-down experiments as previously described. A schematic representation of NCoR functional domains is shown on the right. NR IDs, nuclear receptor interaction domains. SANT; Swi3, Ada2, NCoR, TF11B shared motif. f, Mapping the NCoR interaction interface of Sirt1. GST pull-down experiments were conducted using radiolabelled NCoR RD1 and CBF1/Su(H) interaction domains and the indicated fragments of Sirt1 fused to GST. A schematic representation of full-length Sirt1 is shown on the right. FL, full length; Nt, N-terminal; Ct, C-terminal. g, GST pull-down between the indicated fragments of Sirt1 fused to GST and 35S-methionine-translated SMRT. h, ChIP assay in uninfected 3T3-L1 cells differentiated for 7 days with insulin, IBMX and dexamethasone. i, RNAi of NCoR. 3T3-L1 cells were infected with either pBABE or pBABE–Sirt1 and co-infected with either pSUPER or pSUPER–NCoR RNAi. Puromycin-selected cells were then differentiated with insulin, IBMX and dexamethasone and stained with Oil red O 7 days later.
Figure 4
Figure 4
Sirt1 promotes fat mobilization in vivo. a, Protein levels of Sirt1 in subcutaneous inguinal and visceral epididymal (Epi.) and retroperitoneal (Retro.) WAT depots in wild-type fed mice. Actin levels are shown as loading controls. Each lane represents an individual mouse. b, Weight of epididymal WAT depots in fed Sirt1 +/+ and Sirt1 +/− mice. Bars represent mean + s.e.m. (n = 10–12; NS, not significant). c, In vivo ChiP assay in FVB mice either fed or fasted overnight. Each lane represents an individual mouse. Findings represent five independent experiments done in duplicate. d, Change in FFA levels in blood from age-matched male Sirt1 +/+ and Sirt1 +/− mice between before and after overnight fasting. Bars represent mean + s.e.m. of 27–30 animals. Asterisk indicates a statistical difference from wild-type littermates (P < 0.05). e, Isolated adipocytes from Sirt1 +/+ and Sirt1 +/− mice incubated with or without adrenalin (10−5 M). After 4 h of incubation, FFA released in the medium were measured. Bars represent mean + s.e.m. of triplicate experiments. Asterisk indicates a statistical difference from Sirt1 +/+ adipocytes (P < 0.05).

References

    1. Koubova J, Guarente L. How does calorie restriction work? Genes Dev. 2003;17:313–321. - PubMed
    1. Lin SJ, Defossez PA, Guarente L. Requirement of NAD and SIR2 for life-span extension by calorie restriction in Saccharomyces cerevisiae. Science. 2000;289:2126–2128. - PubMed
    1. Blüher M, Kahn BB, Kahn CR. Extended longevity in mice lacking the insulin receptor in adipose tissue. Science. 2003;299:572–574. - PubMed
    1. Weindruch R, Walford RL. The Retardation of Aging and Disease by Dietary Restriction. Springfield, Illinois: C. C. Thomas; 1988.
    1. Lin SJ, et al. Calorie restriction extends Saccharomyces cerevisiae lifespan by increasing respiration. Nature. 2002;418:344–348. - PubMed

Publication types

MeSH terms