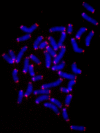
The three-dimensional organization of telomeres in the nucleus of mammalian cells
- PMID: 15176976
- PMCID: PMC425602
- DOI: 10.1186/1741-7007-2-12
The three-dimensional organization of telomeres in the nucleus of mammalian cells
Abstract
Background: The observation of multiple genetic markers in situ by optical microscopy and their relevance to the study of three-dimensional (3D) chromosomal organization in the nucleus have been greatly developed in the last decade. These methods are important in cancer research because cancer is characterized by multiple alterations that affect the modulation of gene expression and the stability of the genome. It is, therefore, essential to analyze the 3D genome organization of the interphase nucleus in both normal and cancer cells.
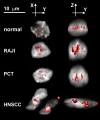
Results: We describe a novel approach to study the distribution of all telomeres inside the nucleus of mammalian cells throughout the cell cycle. It is based on 3D telomere fluorescence in situ hybridization followed by quantitative analysis that determines the telomeres' distribution in the nucleus throughout the cell cycle. This method enables us to determine, for the first time, that telomere organization is cell-cycle dependent, with assembly of telomeres into a telomeric disk in the G2 phase. In tumor cells, the 3D telomere organization is distorted and aggregates are formed.
Conclusions: The results emphasize a non-random and dynamic 3D nuclear telomeric organization and its importance to genomic stability. Based on our findings, it appears possible to examine telomeric aggregates suggestive of genomic instability in individual interphase nuclei and tissues without the need to examine metaphases. Such new avenues of monitoring genomic instability could potentially impact on cancer biology, genetics, diagnostic innovations and surveillance of treatment response in medicine.
Figures


Similar articles
-
Characterizing the three-dimensional organization of telomeres.Cytometry A. 2005 Oct;67(2):144-50. doi: 10.1002/cyto.a.20159. Cytometry A. 2005. PMID: 16163697
-
Novel automated three-dimensional genome scanning based on the nuclear architecture of telomeres.Cytometry A. 2011 Feb;79(2):159-66. doi: 10.1002/cyto.a.21012. Epub 2010 Dec 30. Cytometry A. 2011. PMID: 21265009
-
Nuclear imaging in three dimensions: a unique tool in cancer research.Ann Anat. 2010 Sep 20;192(5):292-301. doi: 10.1016/j.aanat.2010.07.007. Epub 2010 Aug 6. Ann Anat. 2010. PMID: 20800459 Review.
-
Oncogenic remodeling of the three-dimensional organization of the interphase nucleus: c-Myc induces telomeric aggregates whose formation precedes chromosomal rearrangements.Cell Cycle. 2005 Oct;4(10):1327-31. doi: 10.4161/cc.4.10.2082. Epub 2005 Oct 5. Cell Cycle. 2005. PMID: 16205113
-
The significance of telomeric aggregates in the interphase nuclei of tumor cells.J Cell Biochem. 2006 Apr 1;97(5):904-15. doi: 10.1002/jcb.20760. J Cell Biochem. 2006. PMID: 16408280 Review.
Cited by
-
Three-dimensional nuclear telomere architecture changes during endometrial carcinoma development.Genes Chromosomes Cancer. 2013 Aug;52(8):716-32. doi: 10.1002/gcc.22067. Epub 2013 Apr 30. Genes Chromosomes Cancer. 2013. PMID: 23630056 Free PMC article.
-
Distribution of segmental duplications in the context of higher order chromatin organisation of human chromosome 7.BMC Genomics. 2014 Jun 29;15:537. doi: 10.1186/1471-2164-15-537. BMC Genomics. 2014. PMID: 24973960 Free PMC article.
-
Three-dimensional nuclear telomere architecture is associated with differential time to progression and overall survival in glioblastoma patients.Neoplasia. 2010 Feb;12(2):183-91. doi: 10.1593/neo.91752. Neoplasia. 2010. PMID: 20126476 Free PMC article.
-
Resolution of telomere associations by TRF1 cleavage in mouse embryonic stem cells.Mol Biol Cell. 2014 Jul 1;25(13):1958-68. doi: 10.1091/mbc.E13-10-0564. Epub 2014 May 14. Mol Biol Cell. 2014. PMID: 24829382 Free PMC article.
-
Measurement of Telomere Length in Colorectal Cancers for Improved Molecular Diagnosis.Int J Mol Sci. 2017 Aug 29;18(9):1871. doi: 10.3390/ijms18091871. Int J Mol Sci. 2017. PMID: 28850092 Free PMC article.
References
-
- Pienta KJ, Partin AW, Coffey DS. Cancer as a disease of DNA organization and dynamic cell structure. Cancer Research. 1989;49:2525–2532. - PubMed
-
- Rabl C. Über Zellteilung. Morphologisches Jahrbuch Gegenbaur C (ed) 1885;10:214–330.
-
- Marshall WF. Order and Disorder in the Nucleus. Curr Biol. 2003;12:R185–R192. - PubMed
-
- Nagele R, Freeman T, McMorrow L, Lee H-y. Precise spatial positioning of chromosomes during prometaphase: evidence for chromosomal order. Science. 1995;270:1831–1835. - PubMed
Publication types
MeSH terms
LinkOut - more resources
Full Text Sources
Other Literature Sources

