. 2004 Jun 4;3(1):11.
doi: 10.1186/1476-072X-3-11.

Investigation of clusters of giardiasis using GIS and a spatial scan statistic

Affiliations

Investigation of clusters of giardiasis using GIS and a spatial scan statistic

Agricola Odoi et al. Int J Health Geogr. .

Abstract

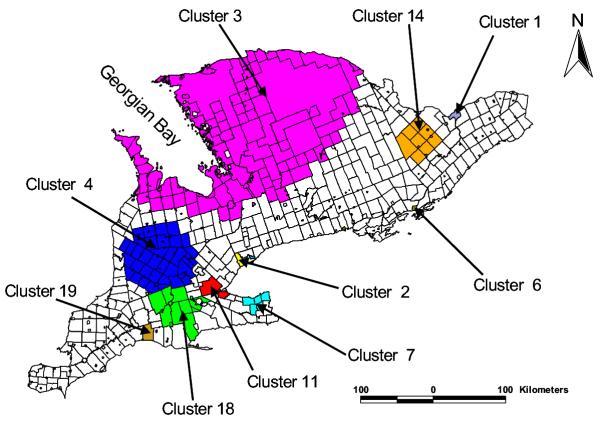
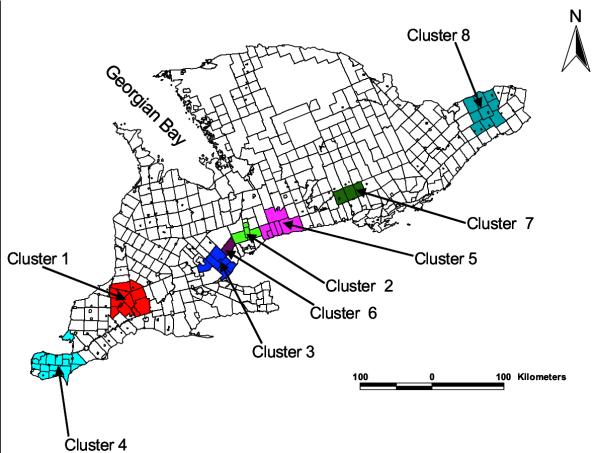
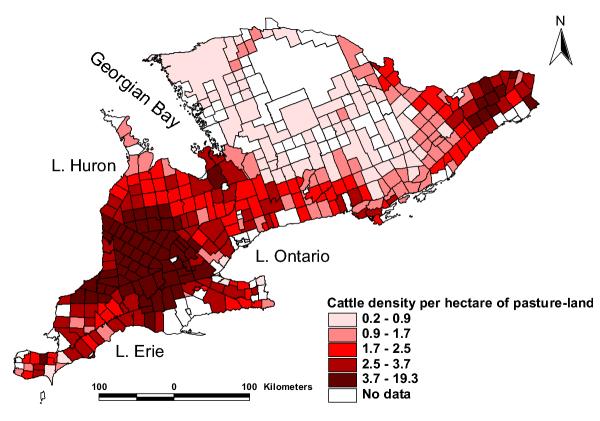
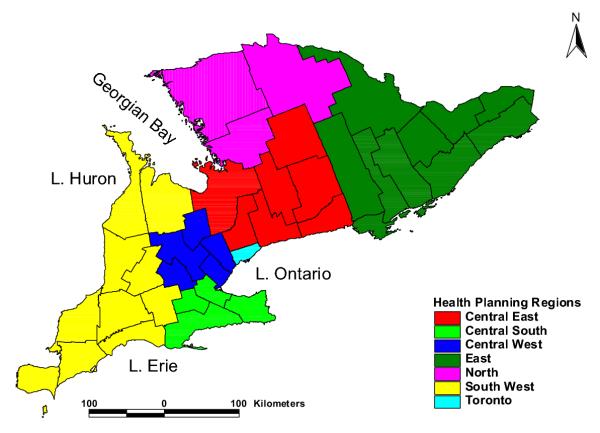
BACKGROUND: Giardia lamblia is the most frequently identified human intestinal parasite in Canada with prevalence estimates of 4-10%. However, infection rates vary by geographical area and localized 'pockets' of high or low infection rates are thought to exist. Water-borne transmission is one of the major routes of infection. Sources of contamination of drinking water include humans, domestic and wild animals. A previous study in southern Ontario, Canada, indicated a bivariate association between giardiasis rates and livestock density and/or manure use on agricultural land; however these variables were not significant when the variable 'rural' was added to the model. In that study, urban areas were defined as those with a minimum of 1,000 persons and a population density of at least 400 persons per Km2; all other areas were considered rural. This paper investigates the presence of local giardiasis clusters and considers the extent to which livestock density and manure application on agricultural land might explain the 'rural' effect. A spatial scan statistic was used to identify spatial clusters and geographical correlation analysis was used to explore associations of giardiasis rates with manure application on agricultural land and livestock density. RESULTS: Significant (P < 0.05) high rate spatial clusters were identified in a number of areas. Results also showed significant (P < 0.05) associations between giardiasis rates and both livestock density and manure application on agricultural land. However, the associations were observed in only two regions. CONCLUSIONS: There is evidence that giardiasis clusters in space in southern Ontario. However, there is no strong evidence to suggest that either livestock density or manure application on agricultural land plays an important role in the epidemiology of giardiasis in the study area. Therefore these factors do not seem to explain the higher rates of giardiasis reported in rural areas. The spatial scan statistics methodology used in this study has an important potential use in disease surveillance for confirming or refuting cluster alarms.


Figures

Figure 1
Figure 1
Distribution of counties or census division (CDs) of southern Ontario. A map of southern Ontario showing the distribution of the Census Divisions in southern Ontario. The numbers in each of the census division polygons are the census division identification codes. The identification codes and names of each of the census divisions (or counties) are as follows: (1; Stormont, Dundas and Glengarry United Counties), (2; Prescott and Russell United Counties), (6; Ottawa-Carleton Regional Municipality), (7; Leeds and Grenville United Counties), (9; Lanark County), (10; Frontenac County), (11; Lennox and Addington County), (12; Hastings County), (13; Prince Edward County), (14; Northumberland County), (15; Peterborough County), (16; Victoria County), (18; Durham Regional Municipality), (19; York Regional Municipality), (20; Toronto Metropolitan Municipality), (21; Peel Regional Municipality), (22; Dufferin County), (23; Wellington County), (24; Halton Regional Municipality), (25; Hamilton-Wentworth Regional Municipality), (26; Niagara Regional Municipality), (28; Haldimand-Norfolk Regional Municipality), (29; Brant County), (30; Waterloo Regional Municipality), (31; Perth County), (32; Oxford County), (34; Elgin County), (36; Kent County), (37; Essex County), (38; Lambton County), (39; Middlesex County), (40; Huron County), (41; Bruce County), (42; Grey County), (43; Simcoe County), (44; Muskoka District Municipality), (46; Haliburton County), (47; Renfrew County), (48; Nipissing District), (49; Parry Sound District)
Figure 2
Figure 2
Distribution of spatial empirical Bayesian smoothed giardiasis rates in southern Ontario (1990–98). The light colored areas had the lowest giardiasis rates while the dark areas had the highest rates.
Figure 3
Figure 3
Spatial distribution of significant high rate giardiasis clusters in southern Ontario (1990–98). Only geographically large clusters have been presented in this map. Detailed descriptions of these clusters as well as the geographically smaller clusters (not presented in this figure) are presented in Table 1. Numerical identification of the clusters are in order of their likelihood ratio; the cluster with the highest likelihood ratio is cluster 1 (most likely cluster) while cluster 2 had the second highest likelihood ratio, etc.
Figure 4
Figure 4
Spatial distribution of significant low rate giardiasis clusters in southern Ontario (1990–98). The numerical identification of the clusters are in order of their likelihood ratio; the cluster with the highest likelihood ratio is cluster 1 (most likely cluster) while cluster 2 had the second highest likelihood ratio, etc. For more detailed cluster information, refer to Table 2.
Figure 5
Figure 5
Spatial distribution of cattle density in southern Ontario. The areas with dark shades of red had the highest cattle densities and those with lighter shades had lower cattle densities.
Figure 6
Figure 6
Geographical distribution of health planning regions in southern Ontario

References

    1. Flanagan PA. Giardia – diagnosis, clinical course and epidemiology. A review. Epidemiol Infect. 1992;109:1–22. - PMC - PubMed
    1. Kappus KD, Lundgren RGJr, Juranek DD, Roberts JM, Spencer HC. Intestinal parasitism in the United States: update on a continuing problem. Am J Trop Med Hyg. 1994;50:705–713. - PubMed
    1. Craun GF. Waterborne outbreaks of giardiasis. Current status. In: Erlandsen SL, Meyer EA, editor. In Giardia and giardiasis: biology, pathogenesis, and epidemiology. New York: Plenum Press; 1984. pp. 243–261.
    1. Gyorkos T. Estimation of parasite prevalence based on submissions to provincial laboratories. Can J Public Health. 1983;74:281–284. - PubMed
    1. Gyorkos T, Meerovitch E, Prichard R. Estimates of intestinal parasite prevalence in 1984: report of a 5-year follow-up survey of provincial laboratories. Can J Public Health. 1987;78:185–187. - PubMed

LinkOut - more resources