. 2004 Jun 15;101(24):9161-6.
doi: 10.1073/pnas.0308256101. Epub 2004 Jun 3.

Age-structured red blood cell susceptibility and the dynamics of malaria infections

Affiliations

Age-structured red blood cell susceptibility and the dynamics of malaria infections

Philip G McQueen et al. Proc Natl Acad Sci U S A. .

Abstract

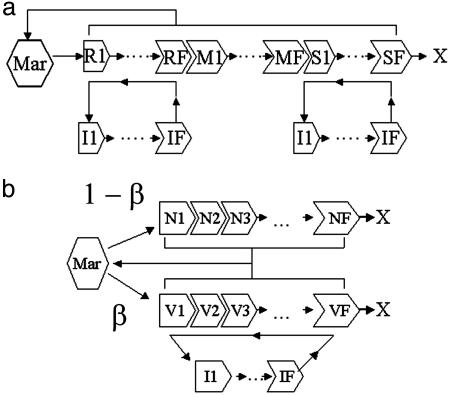
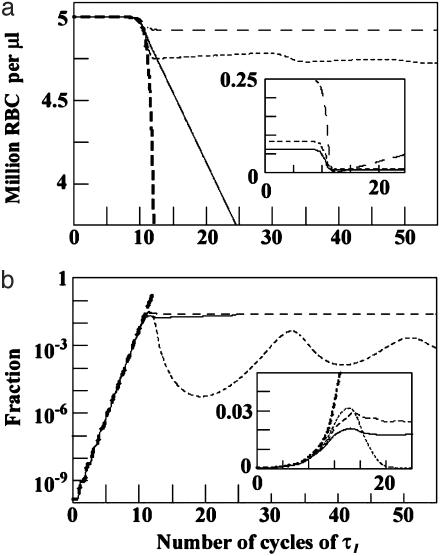
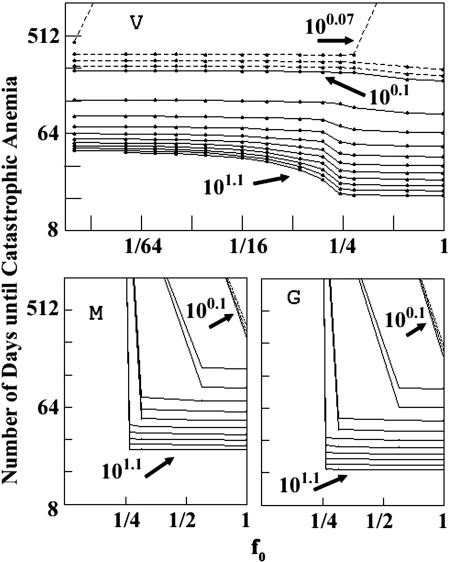
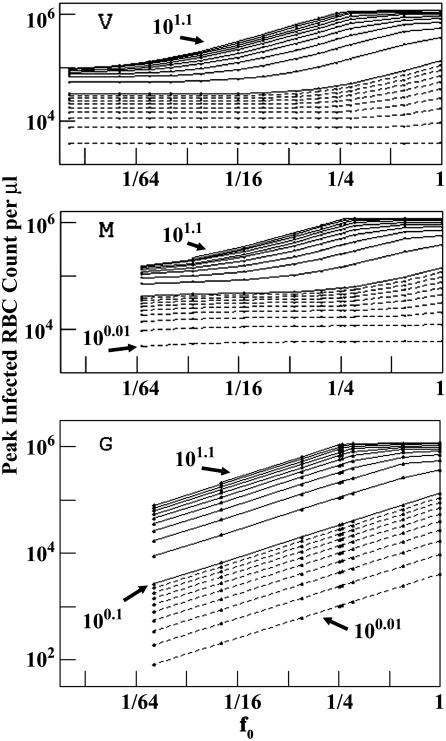
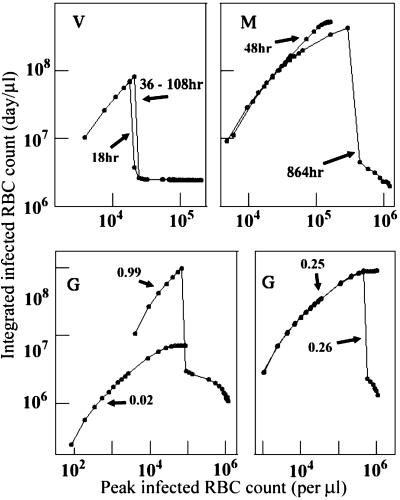
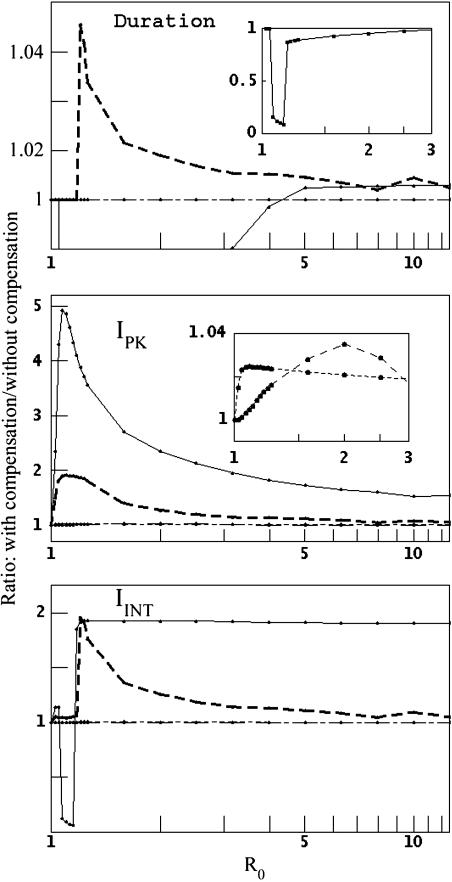
Malaria parasites and immune responses in an infected human interact on a dynamic landscape, in which a population of replicating parasites depletes a population of replenishing red blood cells (RBCs). These underlying dynamics receive relatively little attention, but they offer unique insights into the processes that control most malaria infections. Here, we focus on the observation that three of the four malaria-parasite species that infect humans are restricted to particular age classes of RBC. We explicitly incorporate this observation in models of infection dynamics to distinguish common from species-specific pressures on host immune responses, and we find that age structuring has profound effects on the course of infection. For all four species conditions exist under which the parasites may persist at low densities, or may clear, even in the absence of an immune response. Catastrophic anemia can occur even with the two species that attack only the youngest RBCs, although only a small fraction of cells are parasitized at any point. Furthermore, with these two, compensatory erythropoetic responses in the host accelerate parasite population growth. A "basic reproduction rate" characterizes these differences in outcomes.


Figures

Fig. 1.
Fig. 1.
Schematic of model dynamics. Bone marrow (Mar) is the source of new RBCs. (a) Age-structured models for P. vivax and P. malariae infections. RBC stages R1-RF are reticulocytes, susceptible to P. vivax, and S1-SF are senescent, susceptible to P. malariae;M1-MF are nonsusceptible stages. I1-IF are infected RBCs. (b) Generalist model. V1-VF are the vulnerable subset of RBCs, N1-NF are the nonvulnerable subset; β is the fraction of RBCs produced from marrow that are vulnerable. In all three models, RBC production is regulated by the rate of loss of RBCs by means of normal senescence or infection. Simulations mimic 105 h of infection unless the uninfected RBC count falls to <75% of its initial value (catastrophic anemia). X marks the natural end of the RBC lifespan.
Fig. 2.
Fig. 2.
Time course of infection. The time since primary release (horizontal axis) is shown as multiples of τI (3 days for P. malariae and 2 days for the others). In each case ζ is set so that R0 = 80/13 (or ≈6.15). Lines are coded as:—, P. vivax with reticulocyte duration = 36 h; - -, P. malariae with senescent RBC duration = 48 h; - - -, generalist with β = 0.05; - - -, generalist with β = 0.99. (a) Uninfected RBC count. (Inset) The count of vulnerable RBCs for the P. vivax, P. malariae, and generalist β = 0.05 models. (b) The fraction of RBCs that are infected. (Inset) Enlargement of the region around 10 τI, showing the structure in the “hump.” Note the linear (instead of log) vertical scale of Inset.
Fig. 3.
Fig. 3.
Time to catastrophic anemia as a function of f0, the initial fraction of RBCs susceptible to infection. (Upper) P. vivax.(Lower Left) P. malariae.(Lower Right) Generalist. The solid curves are contours of R0 from 100.1 to 101.1, spaced so that log R0 changes by 0.1. The dotted lines are contours for R0 < 0.1, spaced so that log R0 changes by 0.01.
Fig. 4.
Fig. 4.
Peak count of infected RBCs, IPK, as a function of f0. (Top) P. vivax. (Middle) P. malariae. (Bottom) Generalist. Contours are as in Fig. 3.
Fig. 5.
Fig. 5.
Integrated parasite count, IINT, vs. peak parasite count, IPK, for representative values of susceptible-stage duration (P. vivax in Upper Left and P. malariae in Upper Right)or β (generalist in the two Lower sections). On each curve, the points correspond to values of R0 used in Figs. 3 and 4, from 100.01 on the left to 101.1 on the right.
Fig. 6.
Fig. 6.
Changes in dynamics when RBC production increases with RBC depletion. This figure compares the ratios of model results with compensation (i.e., the RBC production rate matches the RBC depletion rate, up to twice the basal rate) to those without compensation (basal rate only). Lines are coded as in Fig. 2. (Top, Duration) Time to catastrophic anemia. (Middle, IPK) Peak count of infected RBCs. (Bottom,IINT) Integrated parasite count. (Upper Inset) Demonstration that compensation substantially accelerates the onset of catastrophic anemia in P. vivax infection with R0 < 2. (Middle Inset) Demonstration that compensation has relatively little effect on peak density in P. malariae or β = 0.05 generalist infections.

References

    1. White, N. J. & Breman, J. G. (2001) in Harrison's Principles of Internal Medicine, eds. Braunwald, E., Fauci, A. S., Isselbacher, K. J., Kasper, D. L., Hauser, S. L., Longo, D. L. & Jameson, J. L. (McGraw-Hill, New York) pp. 1203-1213.
    1. Molineaux, L. & Dietz, K. (1999) Parassitologia 41, 221-231. - PubMed
    1. Gravenor, M. B., McLean, A. R. & Kwiatkowski, D. (1995) Parasitology 110, 115-122. - PubMed
    1. Hetzel, C. & Anderson, R. M. (1996) Parasitology 113, 25-38. - PubMed
    1. Hoshen, M. B., Heinrich, R., Stein, W. D. & Ginsburg, H. (2000) Parasitology 121, 227-235. - PubMed