Comparative Study
. 1992 Aug 20;226(4):1219-35.
doi: 10.1016/0022-2836(92)91063-u.

Thermal motions of surface alpha-helices in the D-galactose chemosensory receptor. Detection by disulfide trapping

Affiliations
Comparative Study

Thermal motions of surface alpha-helices in the D-galactose chemosensory receptor. Detection by disulfide trapping

C L Careaga et al. J Mol Biol. .

Abstract

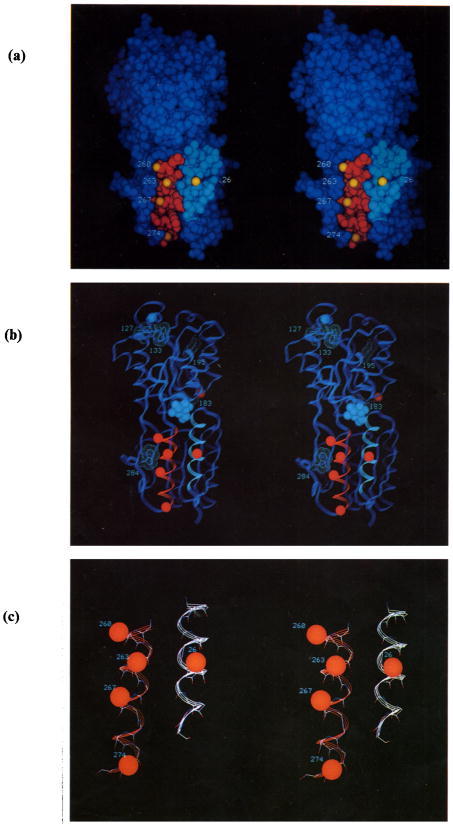
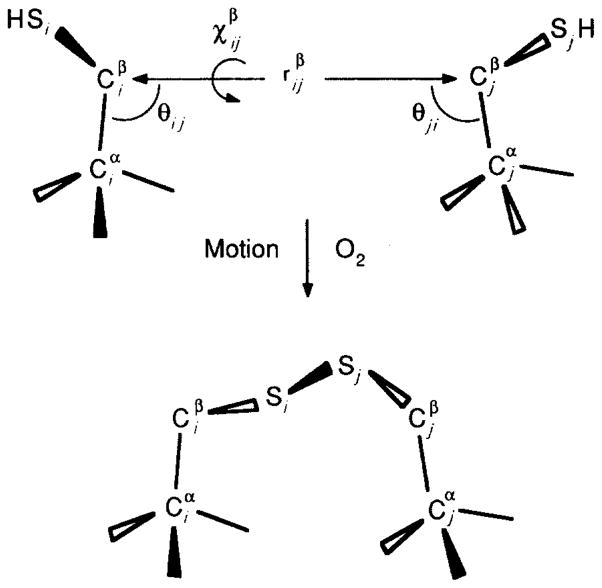
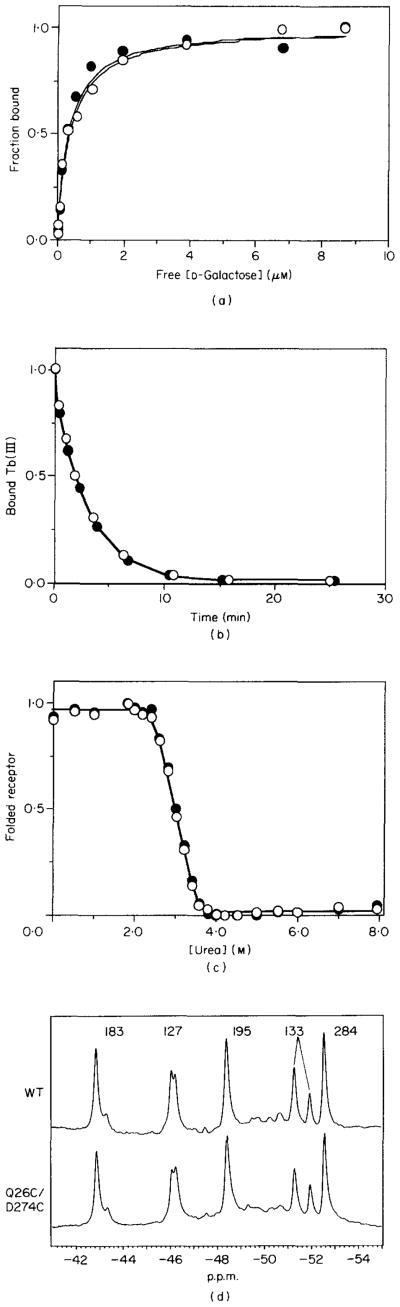
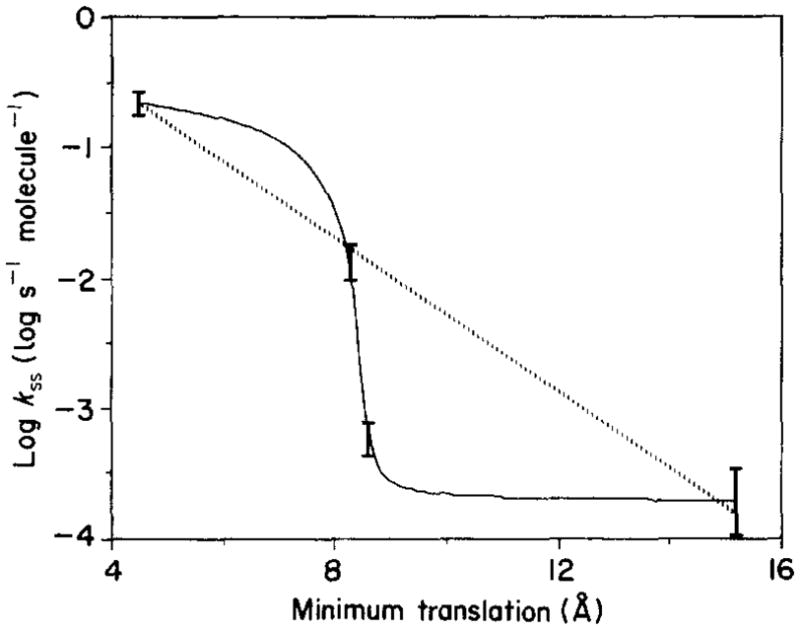
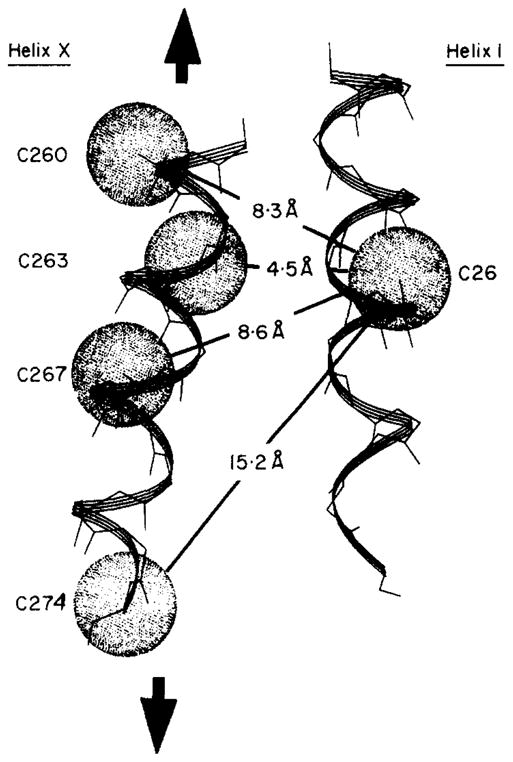
The D-galactose chemosensory receptor of Escherichia coli is a .32 kDa globular protein possessing two distinct structural domains, each organized in an alpha/beta folding motif. Helices I and X lie at adjacent approximately parallel positions on the surface of the N-terminal domain, near the hinge region. In order to analyze the relative thermal motions of these two helices, the present study utilizes a generalizable disulfide trapping approach: first, site-directed mutagenesis is used to place a pair of cysteine residues at locations of interest on the protein surface, then disulfide bond formation is used to trap intramolecular cysteine-cysteine collisions resulting from thermal motions. Specifically, four engineered di-cysteine receptors have been constructed, each possessing one cysteine at position 26 on helix I, and a second cysteine at varying positions on helix X. A fifth control receptor possesses one cysteine at position 26, and a second on the opposite surface of the molecule. These surface cysteine substitutions have little or no effect on the measurable receptor parameters as judged by ligand binding equilibria and kinetics, protein stability, and 19F nuclear magnetic resonance, indicating that the engineered receptors are useful probes of native backbone dynamics. Spatial and kinetic features of backbone motions have been investigated by measuring intramolecular disulfide formation rates for cysteine pairs in the fully liganded receptor. The resulting rates decrease monotonically with increasing distance between cysteines in the crystal structure, while no disulfide formation is observed for the control pair unless the molecule is unfolded. The minimum translational amplitudes of the observed backbone motions range from 4.5 to 15.2 A, and the minimum rotational amplitudes are as large as 35 degrees. For each motion the rate of intramolecular sulfhydryl-sulfhydryl collision has been estimated from the measured rate of disulfide formation: the 4.5 and 15.2 A translations yield approximately 10(4) and approximately 10 collisions s-1 molecule-1, respectively. These collision rates, which are faster than ligand dissociation, likely underestimate the actual motional frequencies since only an undetermined fraction of the total motions yield collisions. The simplest plausible trajectory capable of producing such collisions is a rate-limiting translation of one or both helices along their long axes, coupled with minor helix rotations. When sugar is removed from the receptor, a substantial increase in backbone dynamics is observed, indicating the presence of new long-range backbone trajectories. Overall, the results suggest that internal motions in proteins may have larger amplitudes than previously observed.


Figures

Figure 1
Figure 1
(a) Stereoscopic van der Waals (VDW) surface of the E. coli D-galactose and D-glucose receptor (Vyas et al., 1987). α-Helices I and X are highlighted (cyan and red, respectively), as are the numbered positions of the engineered cysteine residues (yellow surfaces indicate β-carbons). One engineered cysteine, the control at position 182 on the opposite surface of the molecule, is not visible. Buried D-glucose is largely hidden (green, near center), (b) Ribbon backbone trace viewed from the same angle. The solid surfaces represent bound D-glucose and Ca(II) (cyan VDW), as well as the β-carbons of the 6 residues substituted with cysteine (red VDW), while the numbered dot surfaces indicate the 5 tryptophan residues (cyan VDW). (c) Expanded view of helices I and X, again showing the β-carbons of the cysteine-substituted side-chains (red VDW).
Figure 2
Figure 2
Geometric parameters for 2 cysteine residues forming a disulfide bond, focusing on the Cα–Cβ bonds of cysteine residues i and j. It is convenient to define a pseudo-bond between the β-carbons (upper). The resulting pseudo-bond length rijβ, pseudo-dihedral angle χijβ, and pseudo-bond angles θij and θji are used to determine whether the residues have a relative geometry suitable for disulfide formation (Balaji et al., 1989).
Figure 3
Figure 3
Comparison of the wild-type (●) and Q26C/D274C receptors (○), the latter always in reduced form. (a) D-Galactose binding to the Ca(II)-occupied receptor, assayed by an increase in the intrinsic tryptophan fluorescence. (b) Timecourse of Tb(III) dissociation from the Ca(II) binding site of the D-glucose occupied receptor, following the addition of excess EDTA. Bound Tb(III) was assayed by its phosphorescence following energy transfer from nearby tryptophan 127. (c) Urea denaturation of receptor containing bound D-glucose and Ca(II), assayed by a decrease in the intrinsic tryptophan fluorescence. (d) 19F n.m.r. spectra of the 5-fluorotryptophan-labeled receptor containing bound D-glucose and Ca(II). As previously noted, the W127 and W133 resonances detect 2 stable conformers in their local environment. The ratio of these conformers varies for different preparations (Falke & Luck, 1991a,b), as observed here. For (a) to (c) the best fit parameters (D-galactose KD, Tb(III) kd, and ΔGDH2O, respectively) were determined by non-linear least-squares regression and are summarized in Table 2. For (d) the resonance frequencies are summarized in Table 3. See Experimental Procedures for further details. WT, wild-type; p.p.m., parts per million.
Figure 4
Figure 4
Disulfide formation timecourse for the Q26C/D263C receptor containing bound D-glucose and Ca(II) at 37°C. At t = 0 the redox catalyst Cu(II)(1,10-phenanthroline)3 was added to trigger the reaction. Subsequently, portions were removed at the indicated times and quenched, then disulfide formation was quantified by SDS/polyacrylamide gel electrophoresis. Non-linear least-squares best fit of eqn (6) yielded the indicated curve, as well as the best fit rate parameters kss, k2 and Fss(∞) listed in Table 4. The reaction contained 2 μM-receptor, 190 μM-O2 (ambient), 1·5 mM-Cu(II)(1,10-phenanthroline)3, 50 mM-KCl, 50mM-NaCl, 1·0 mM-D-glucose, 0·2mM-CaCl2, 1·0 mM-NaAsO2, 20 mM-NaH2PO4 (pH 7·0 with NaOH). See Experimental Procedures for further details.
Figure 5
Figure 5
Dependence of the disulfide formation rate on the calculated minimum translation distance. For each di-cysteine receptor, the rate constant for intramolecular disulfide formation was determined (as in Fig. 4), and the minimum translation required for disulfide formation was calculated from the distance between the 2 cysteine β-carbons in the starting crystal structure ( Δtrrijβ4·6; see Discussion). Shown are rate constants for the Q26C/K263C, Q26C/N260C, Q26C/D267C and Q26C/D274C receptors, in order of increasing translation. The continuous curve is an interpolation including all 4 rate constants; the broken line is a linear least-squares best fit when the rate constant of Q26C/D267C is omitted. See Discussion for further details.
Figure 6
Figure 6
Model for the backbone motion observed by disulfide trapping. Shown are helix I (right) and helix X (left). For each engineered cysteine position the approximate sulfhydryl collision surface (2·3 Å) is indicated by the stippled sphere; in order for a disulfide bond to form, the collision surfaces of 2 cysteine residues must intersect. Helix X is proposed to give the largest translations, indicated by the bold arrows. The minimum translational distance, which is calculated as the distance between the 2 collision surfaces, is indicated for each cysteine pair. See Discussion for further details.

Similar articles

Cited by

References

    1. Altenbach C, Marti T, Khorana HG, Hubbell WL. Transmembrane protein structure: spin labeling of bacteriorhodopsin mutants. Science. 1990;248:1088–1092. - PubMed
    1. Argos P, Mahoney WC, Hermodson MA, Hanei M. Structural prediction of sugar-binding proteins functional in chemotaxis and transport. J Biol Chem. 1981;256:4357–4361. - PubMed
    1. Balaji VN, Mobasser A, Rao SN. Modification of protein stability by introduction of disulfide bridges and prolines: geometric criteria for mutation sites. Biochem Biophys Res Commun. 1989;160:109–114. - PubMed
    1. Boos W, Gordon AS, Hall RE, Price DH. Transport properties of the galactose-binding protein of Escherichia coli: substrate induced conformational change. J Biol Chem. 1972;247:917–924. - PubMed
    1. Bowie JU, Reidhaarolson JF, Lim WA, Sauer RT. Deciphering the message in protein sequences: tolerance to amino acid substitutions. Science. 1990;247:1306–1310. - PubMed

Publication types

MeSH terms

LinkOut - more resources